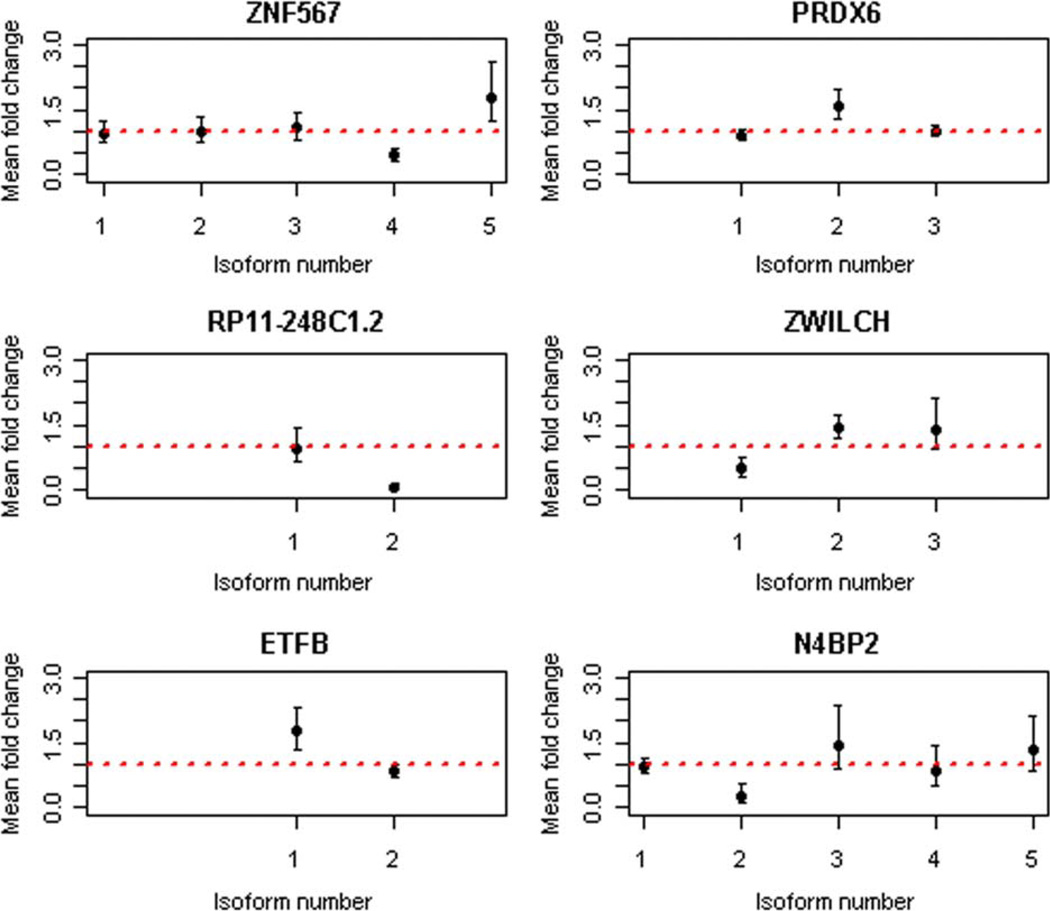
Fig. 4.
Alternatively spliced transcripts due to benzene exposure. The x-axes of the subplots for the six transcripts contain the indices of the all the isoforms of the corresponding transcripts with detectable reads from the RNA-seq experiment. The scale on the y-axes corresponds to the mean fold change. The error bars correspond to the 95% confidence intervals of these mean fold changes. The dotted line corresponds to a fold change of 1.

