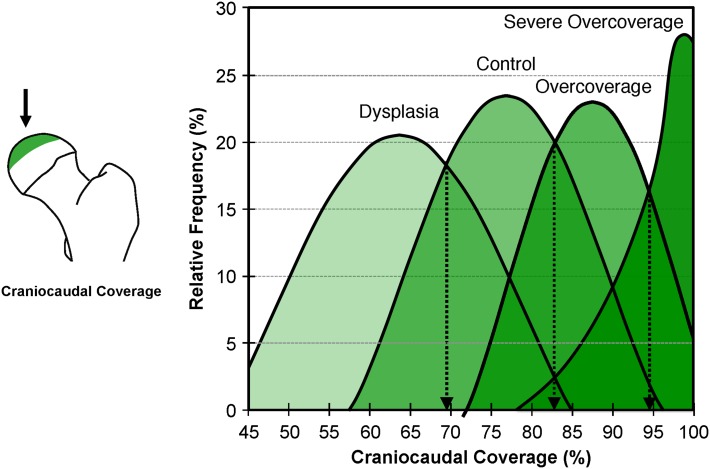
Fig. 5.
The distribution curves for craniocaudal coverage of the four study groups are shown as an example for definition of the range of values for each group. The intersection of the distribution curves resulted in the definition thresholds for each parameter (Table 4). Image to the left indicates craniocaudal coverage and craniocaudal view direction (black arrow).

