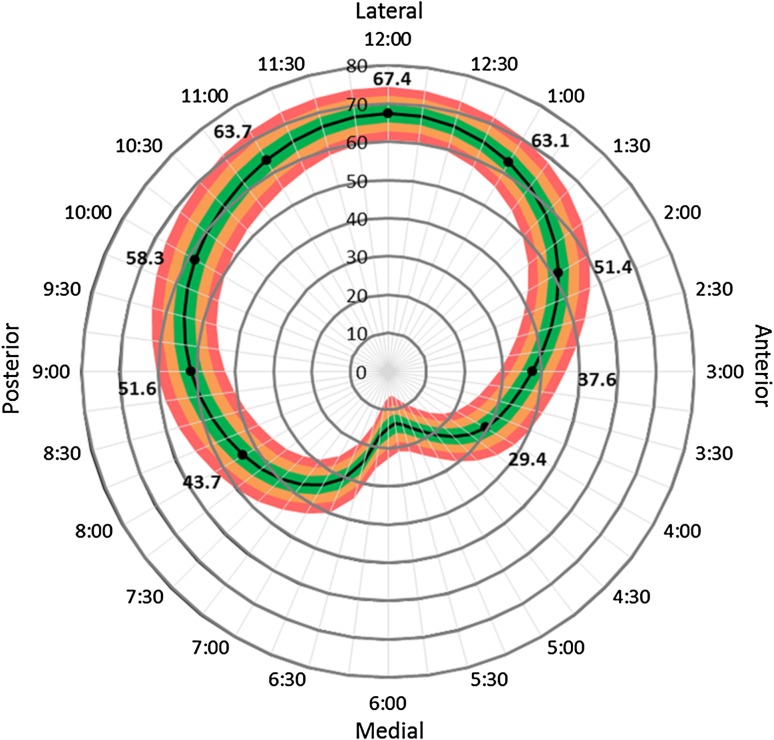
Fig. 1.
The surface area coverage percentages were computed from the projection of the acetabulum rim curve onto the best-fitting sphere of the femoral head. The mean coverage percentage ± 3 SD at each clockface location is shown: Red line = ± 3 SD; orange line = ± 2 SD; green line = ± SD; black line = average.

