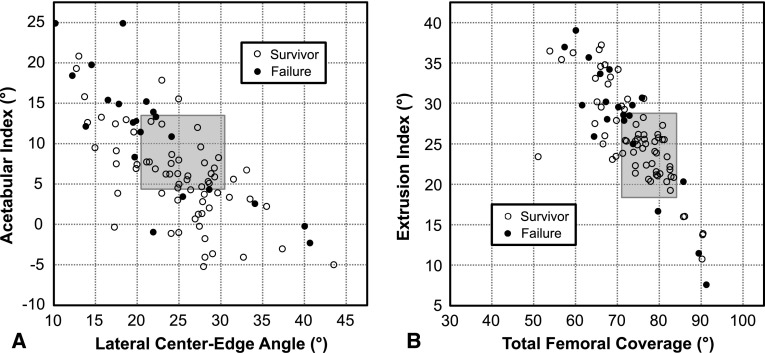
Fig. 2A–B.
Scatterplots showing postoperative radiographic parameters describing acetabular morphology. The gray area represents the normal values for the radiographic parameters [37] and the white and black dots represent the surviving hips and failures at 10-year followup, respectively. Most failures had a dysplastic acetabular morphology with an (A) excessive acetabular index or (B) extrusion index and a deficient (A) LCEA or (B) total femoral coverage. At 10-year followup some hips failed with an acetabular morphology of persisting pincer type.

