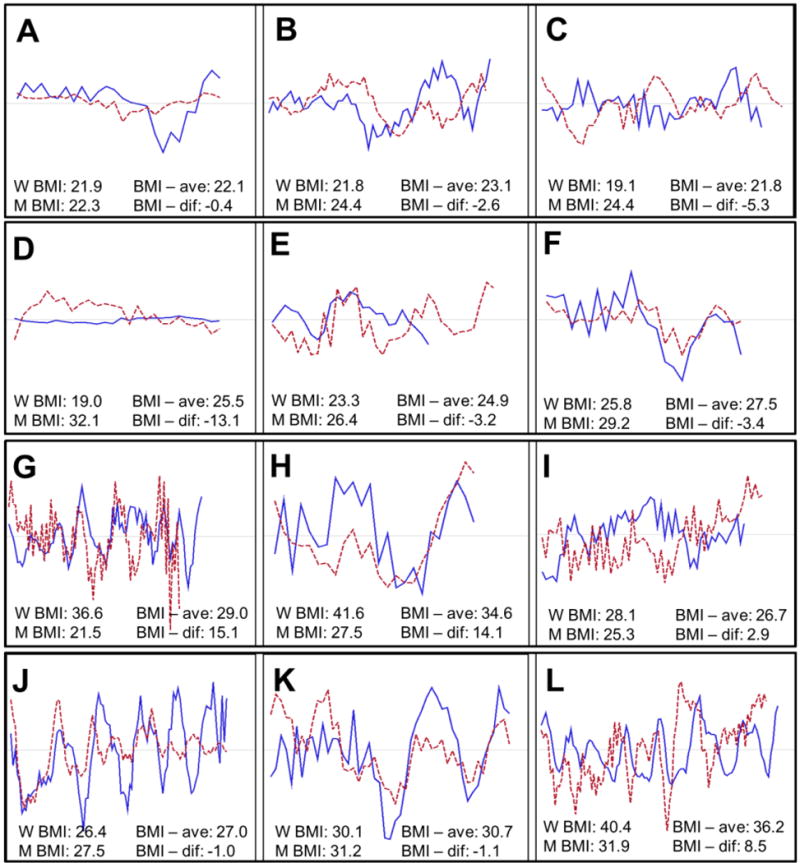
Figure 2.

Representative plots of couples’ raw emotion ratings (y-axis) over time (x-axis). The solid line refers to the female partner and the dotted line refers to the male partner. BMI = body mass index; BMI – ave = couple average BMI (female + male / 2); BMI – dif = couple difference in BMI (female – male). Panels A, B, and C are representative of healthy-weight couples; Panels D, E, and F are representative of mixed-weight couples with a heavier man (M > W); Panels G, H, and I are representative of mixed-weight couples with a heavier woman (W > M); Panels J, K, and L are representative of overweight couples. Because couples’ conversation lengths were allowed to differ, the time scales for the panels are different, ranging from ~7 to ~17 minutes.
