Fig. 4.
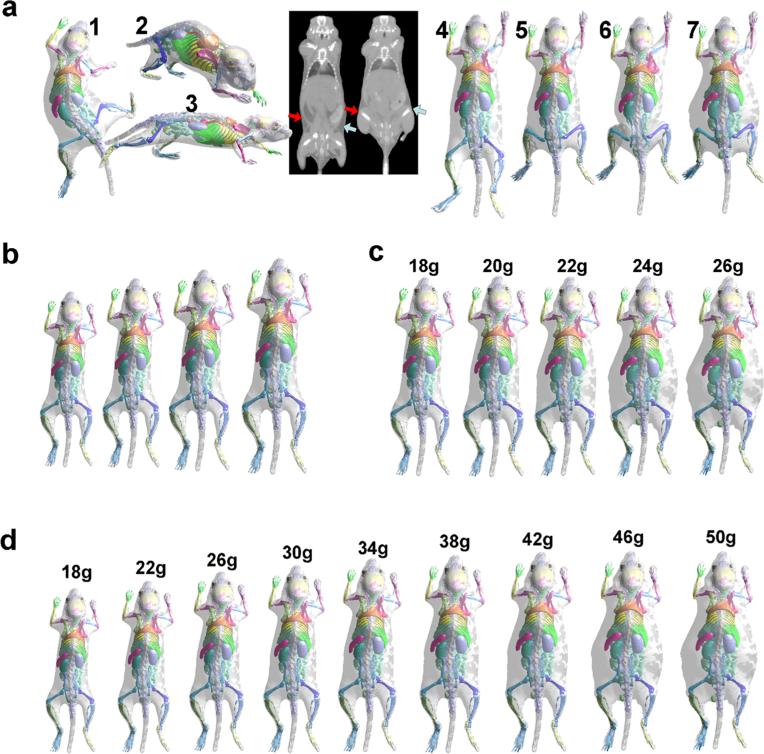
Test results of the pose and weight changes. a Results 1~3 are atlases of different poses. The two CT images in the middle show the skin sliding effect at the waist area when large femur rotation happens. The arrows point to the area where the muscles slide under the skin, and different arrow colors are used for different body sides. Results 4 and 5 show that the atlas realistically replicates the skin sliding effect. In comparison, the SSD method yields a skin folding artifact, as shown by result 6. Result 7 shows that the atlas can perform superimposed pose and weight change. b Results of only changing the body size. c Results of only changing the fat amount. d Results of combined body size and fat amount changes. For c and d, the body weight is marked on top of each image.

