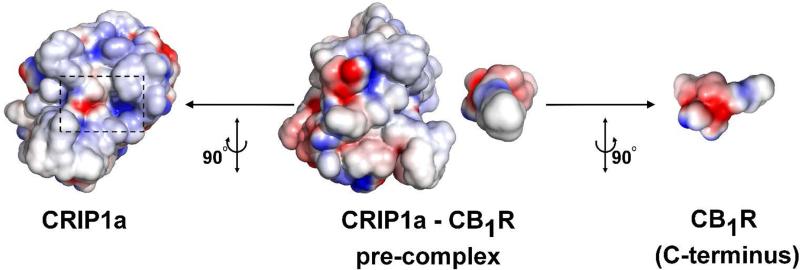
Figure 8.
Complementarity of electrostatic potentials at the interface of the predicted CRIP1a-CB1R complex. In the middle, CRIP1a and CB1R C-terminus are aligned in a pre-complex position to better show the spatial complementarity of electrostatic potentials of the molecules. Positive potential is shown as blue and negative potential is shown as red. To the left, CRIP1a is shown; the CB1R binding site is enclosed in a back dashed rectangle. To the right, the binding interface of the C-terminus of CB1R is shown. It can be clearly seen the complementarity of electrostatic potentials at the interface of the complex, as the area of the positive potential (blue) on CRIP1a faces the negative potential (red) on CB1R C-terminus and vice versa.

