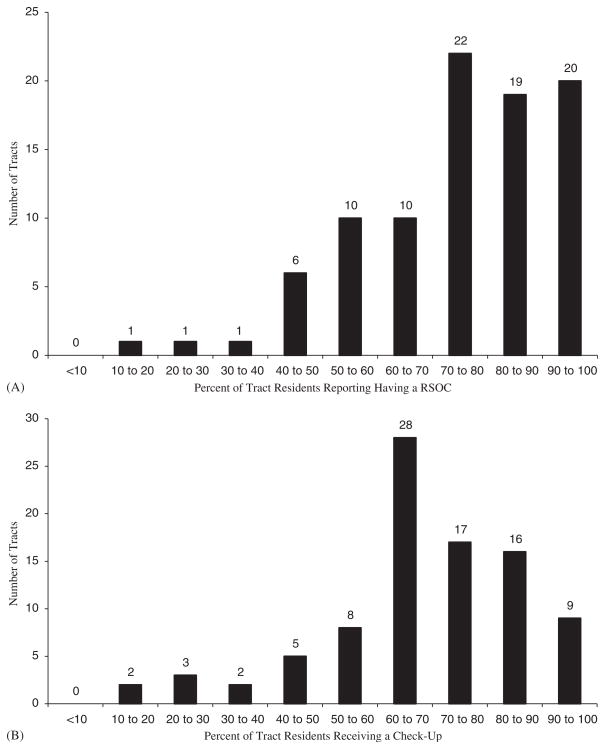
Fig. 1.
(A) Histogram showing the distribution of residents reporting having a RSOC in each census tract; L.A. FANS 2000–2001 (Adults 18–64 years old, n = 2041). The mean number of respondents per tract is 23. Tracts with 100% have a range of 2–33 people. (B) Histogram showing the distribution of residents receiving a check-up in each census tract; L.A. FANS 2000–2001 (Adults 18–64 years old, n = 2080). The mean number of respondents per tract is 23. Tracts with 100% have a range of 2–9 people.

