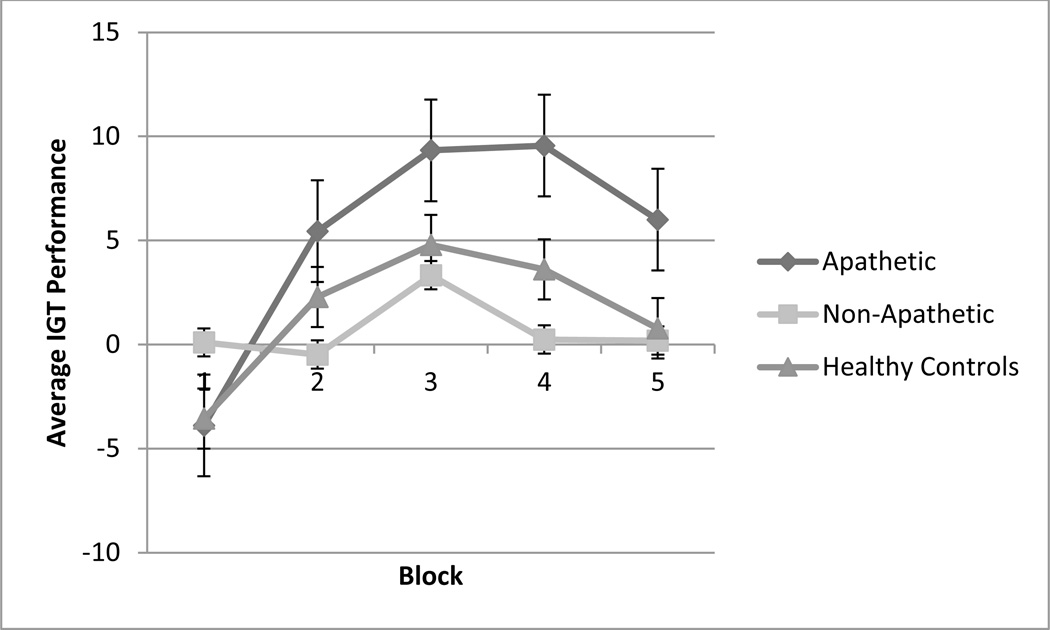
Figure 2.
Average IGT performance over time for healthy controls, non-apathetic, and apathetic participants. The x-axis represents the five trial blocks of the task and the y-axis shows the average IGT performance score, which is calculated by subtracting the total number of cards chosen from the risky decks from the total number of cards chosen from the conservative decks.

