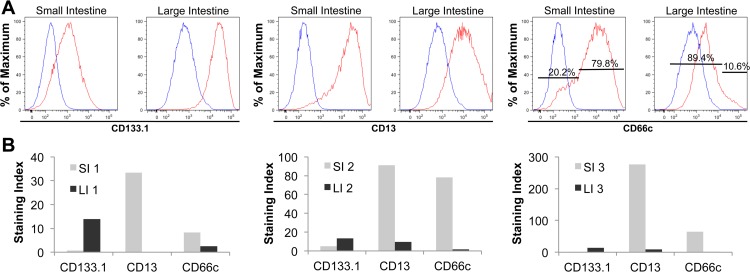
Fig 2. Expanded small and large intestinal cells show different cell surface marker expression.
(A) Flow cytometric analysis of CD133.1, CD13 and CD66c expression on expanded cells from one paired SI and LI sample (SI and LI depicted here originated from the same tissue source). The histograms show one representative set of three paired samples examined presenting unstained control (blue) and stained live, EPCAM+ cells (red). For CD66c, the percentage of low and high expressing cells is provided. All markers were PE-labeled. The same control was used for SI CD13 and CD66c as well as LI CD133 and CD13 because the staining was done at the same time. (B) Corresponding staining index of three paired samples showing reproducible results between the paired SI and LI samples (1, 2 and 3) (staining index = D/W, where D is the distance between the positive and negative populations and W is two standard deviations of the negative population).

