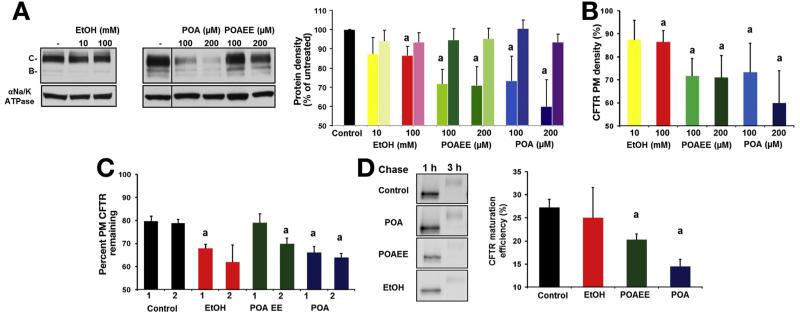
Figure 6.
Effect of ethanol and its metabolites on CFTR and Na+/K+-ATPase expression. (A) Immunoblotting and densitometry of CFTR and Na+/K+-ATPase expression levels in transfected MDCK monolayers after 48 hours of treatment with ethanol, POA, or POAEE (right panel). Results are expressed as percentage of the complex glycosylated CFTR (band C) or Na+/K+-ATPase expression in untreated cells (control). (First column, CFTR; second column, Na+/K+-ATPase for each condition.) (B) Enzyme-linked immunosorbent assay measurement of the apical plasma membrane (PM) density of CFTR revealed that ethanol, POA, and POAEE decreased this parameter after 48 hours of incubation. Results are presented as percentage of CFTR cell surface density of the untreated cells. (C) Ethanol, POAEE, and POA reduce the PM stability of CFTR determined by cell surface enzyme-linked immunosorbent assay. Cell surface resident CFTR was labeled with anti-HA antibody and chased for 1 or 2 hours in the presence of the indicated compounds at 37− C. Results are presented as percentage of the initial CFTR surface density (1 and 2 indicate 1-hour and 2-hour chase, respectively). (D) CFTR folding efficiency was reduced by 100 mmol/L ethanol and diminished by 200 μmol/L POA or POAEE after 48 hours. CFTR folding efficiency was calculated as the percentage of the pulse-labeled, core glycosylated form converted into the mature complex glycosylated form during 3-hour chase. n = 3 for each condition. aP < .05 vs control.

