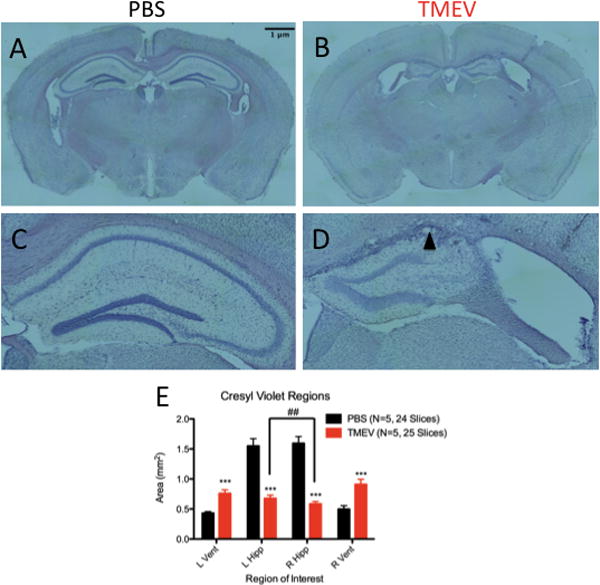
Figure 5. Hippocampi from TMEV animals display sclerosis with severe tissue atrophy.

(A–D) Coronal sections (40μm) of dorsal hippocampi from control (A) and TMEV (B) animals. Clear atrophy of the hippocampus and enlargement of ventricles can be seen in slices from TMEV animals. At 10X magnification, clear preservation of cellular organization can be observed in the right hippocampus of a control animal (C); however, loss of CA1 and CA2 is evident in the right hippocampus of TMEV animals. Glial scarring (black arrow) is also observed in sclerosed TMEV hippocampi. (E) Quantification of left and right hippocampal and ventricle areas from control and TMEV animals. Both left and right hippocampal area is reduced in TMEV animals compared to controls, while lateral ventricles are enlarged. The right hippocampus, ipsylateral to the injection site, is more severely atrophied in TMEV animals compared to the left hippocampus. ##(p<0.01), paired t-test within subjects; ***(p<0.001) t-test between treatment groups. L=Left, R=Right, Vent=Ventricle, Hipp=Hippocampus. Data are displayed as mean ± S.E.M.
