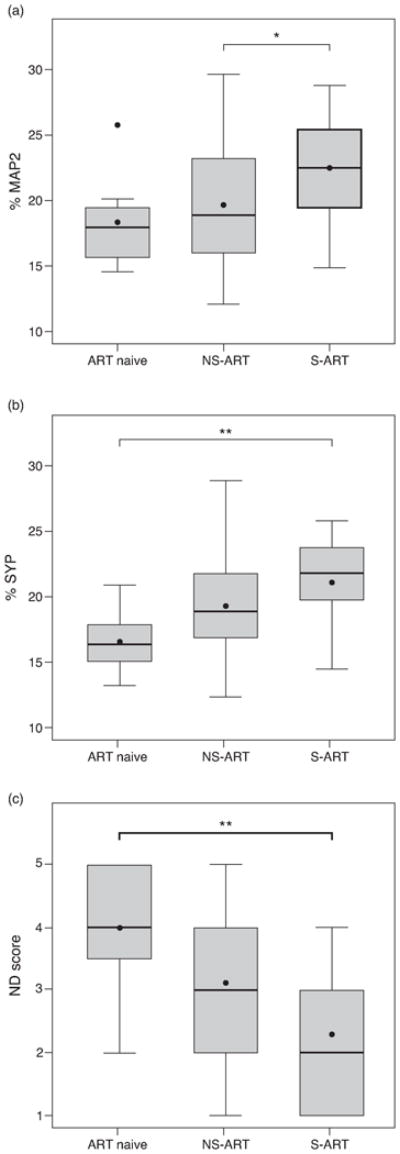
Figure 2. Virally suppressive ART exerts a protective effect against measures of synaptodendritic neurodegeneration.

(a) Comparison of MAP2 percentage across ART groups. The S-ART group shows higher MAP2 percentages than the NS-ART group (p = 0.044, one-way ANOVA followed by Tukey's post hoc test). (b) Comparison of SYP percentage across ART groups. The S-ART group shows higher SYP percentage when compared to ART Naïve (p = 0.007, one-way ANOVA followed by Tukey's post hoc test). (c) Comparison of ND score across ART groups. The S-ART group shows lower ND score, representing less neurodegeneration, when compared to ART naïve (p = 0.01, one-way ANOVA followed by Tukey's post hoc test). * p < 0.05; ** p < 0.01.
