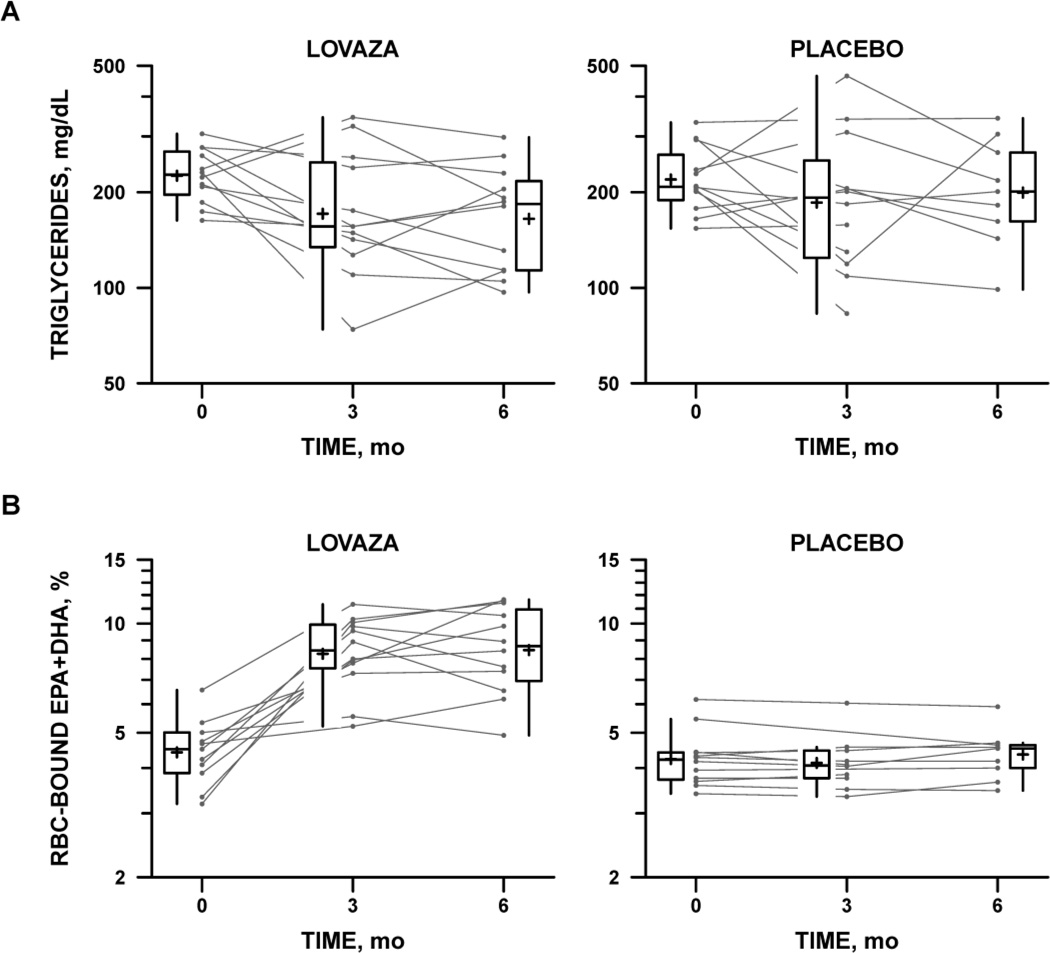
Figure 2.
Serum triglycerides (Panel A) and percentage of eicosapentaenoic acid (EPA) + docosahexaenoic acid (DHA) found in red cell membranes (Panel B) by treatment allocation and study time point. A: Serum triglyceride levels in the Omega-3 FA treatment arm (left) and placebo arm (right). Box plots summarize the distribution of triglyceride levels at each time point. Cross (+) indicates the mean, center line the median, top and bottom the interquartile range (IQR). Vertical lines extend to the farthest data point within 1.5×IQR above or below the box. Individual subjects’ levels are represented by a line connecting baseline (time 0) with 3-month and 6-month follow-up levels. B: Percentage of EPA and DHA bound to red blood cell (RBC), a marker of compliance with Omega-3 FA treatment. Format as in A

