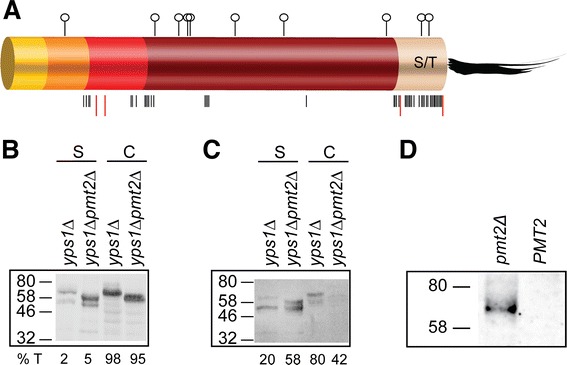
Figure 7.

Hypoglycosylation of Yps1 stimulates shedding of both native Yps1 and Yps1-DL. A) Schematic view of Yps1 glycosylation profile and cleavage sites. Potential O-glycosylation sites, as determined by the NetOGlyc 4.0 algorithm (http://www.cbs.dtu.dk/services/NetOGlyc/) [23], are indicated with black bars whereas putative and/or known cleavage sites within these regions are illustrated by red bars. N-glycosylation sites are represented with a symbol. B) Cell extracts (C) and concentrated supernatants (S; 20-times more material compared to cell extracts) from 24 h cultures at pH 6.0 of the indicated yeast mutants transformed with plasmid Yps1 were treated with Endo Hf, separated by 10% SDS-PAGE and immunodetected with an Yps1 antiserum (294–3). C) Cell extracts (C = 1.23 × 10⁷ cells equivalent) and concentrated supernatants (S; 5-times more material compared to cell extracts), from 24 h cultures at pH 6.0, of the indicated yeast mutants transformed with Yps1-DL were treated with Endo Hf, fractionated by 10% SDS-PAGE and immunoblotted with an Yps1 antiserum (268–6). The percentage of total Yps1-immunoreactive material (%T) associated with cell extracts and supernatants is indicated for both Yps1 and Yps1-DL transformed yeast. D) Concentrated supernatants from 24 h cultures at pH 3.0 (5.6 × 10⁷ cells equivalent) of the indicated yeast mutants transformed with the catalytically inactive form of Yps-DL (Yps1-DL2) and analyzed as in C).
