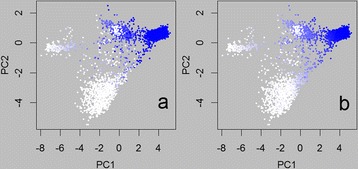
Figure 6.

Predicted Romney proportions for the training set. Predicted Romney proportions, plotted on the positions of the first two principal components (PC2 v PC1) for the 4342 training animals available in the August 2011 dataset. Colours range from white (proportion of zero) to a full intensity blue (proportion of one). Subpanels show the two prediction methods: a) Genomic Selection, b) Regression.
