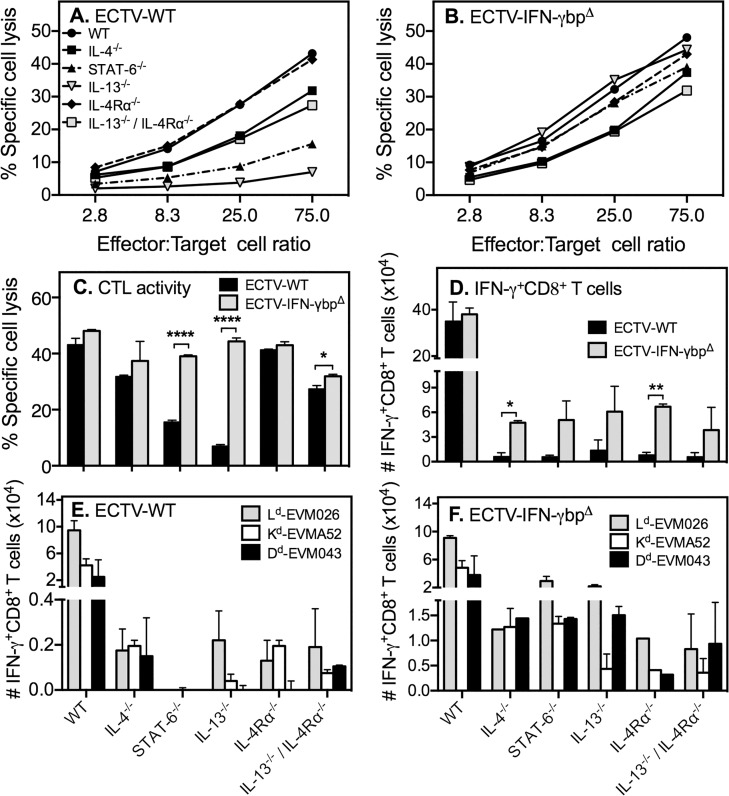
Fig 4. CD8 T cell responses to ECTV-WT and ECTV-IFN-γbpΔ.
Mice (n = 5–10/group) were infected with ECTV-WT or ECTV-IFN-γbp and sacrificed 7 days later to measure splenic CTL activity. Shown is % specific lysis of 51Cr-labelled, ECTV-infected P815 target cells by splenocytes from (A) ECTV-WT- or (B) ECTV-IFN-γbpΔ-infected WT and GKO mice. (C) Percent specific lysis of targets by splenocytes at 75:1 effector-to-target ratio. Two-way ANOVA followed by Fisher’s LSD test for significance was used for statistical analysis: (i) CTL response to ECTV-WT vs. ECTV-IFN-γbpΔ in IL-13−/− (p < 0.0001) and STAT-6−/− (p < 0.0001) (ii) CTL response to ECTV-WT in WT vs IL-4−/− (p = 0.0083), vs STAT-6−/− (p = 0.0003), vs IL-13−/− (p = 0.0001), vs IL-13−/−/IL-4Rα−/− (p = 0.0037) mice; (iii) CTL response to ECTV-IFN-γbp in WT vs STAT-6−/− (p = 0.0002); vs IL-13−/− (p = 0.0478); vs IL-4Rα−/− (p = 0.0174) and IL-13−/−/IL-4Rα−/− (p = 0.000046) mice. ****, p<0.0001. (D—F) Spleen cells from mice infected mice were re-stimulated for 5 h with ECTV-infected P815 cells or H-2d 8 T cell peptide determinants prior to intracellular IFN-γ staining followed by flow cytometry. Data shown are means of absolute numbers of ECTV-specific IFN-γ+ 8 T cells in spleens of ECTV-WT- vs. ECTV-IFN-γbpΔ-infected mice (D) and determinant-specific IFN-γ+ 8 T cells following infection with ECTV-WT (E) or ECTV-IFN-γbp (F) viruses. Two-way ANOVA followed by Fisher’s LSD test for significance was used for statistical analysis. For panels D, E and F, IFN-γ+ 8 T cell numbers in WT mice were significantly higher (p<0.0001) than numbers in all GKO strains. Data shown for D-F are representative of one of three independent experiments with similar results. *, p< 0.05; **, p < 0.01; ***, p < 0.0001.

