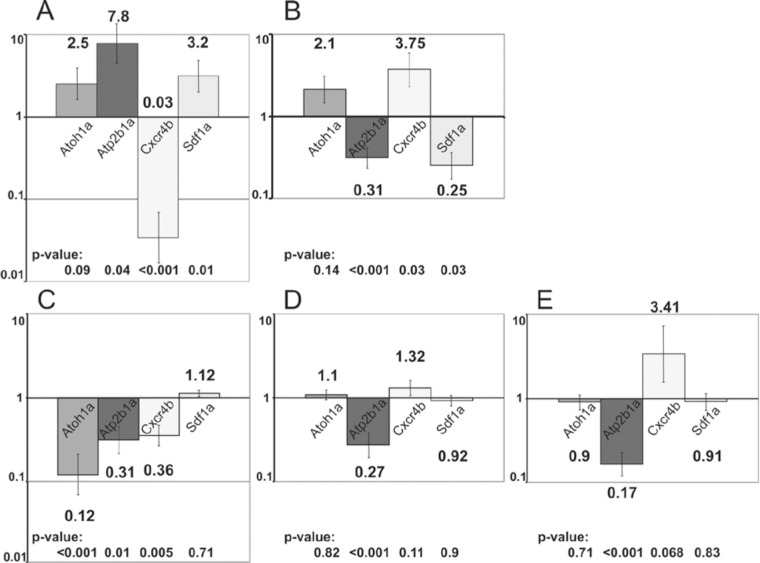
Fig 4. RT-PCR gene expression analysis of whole 36 hpf embryos (A-B) and the tail of 48 hpf embryos (C-E).
A, C—expression of genes in embryos injected with nTrk2b antisense morpholino (0.1 pmol), 5mm-nTk2b-MO-injected embryos (0.3 pmol) were used as a control; B, D—expression of genes in embryos injected with mRNA of mature BDNF (100 pg), water-injected embryos were used as a control; E—expression of genes in embryos treated with mature BDNF (200 ng/ml), untreated embryos were used as a control. Logarithmic scale, the value of the control was set to one, standard errors are indicated on the tops of the bars. Data were compared with control by Student two-tailed t-test, p-value was calculated.

