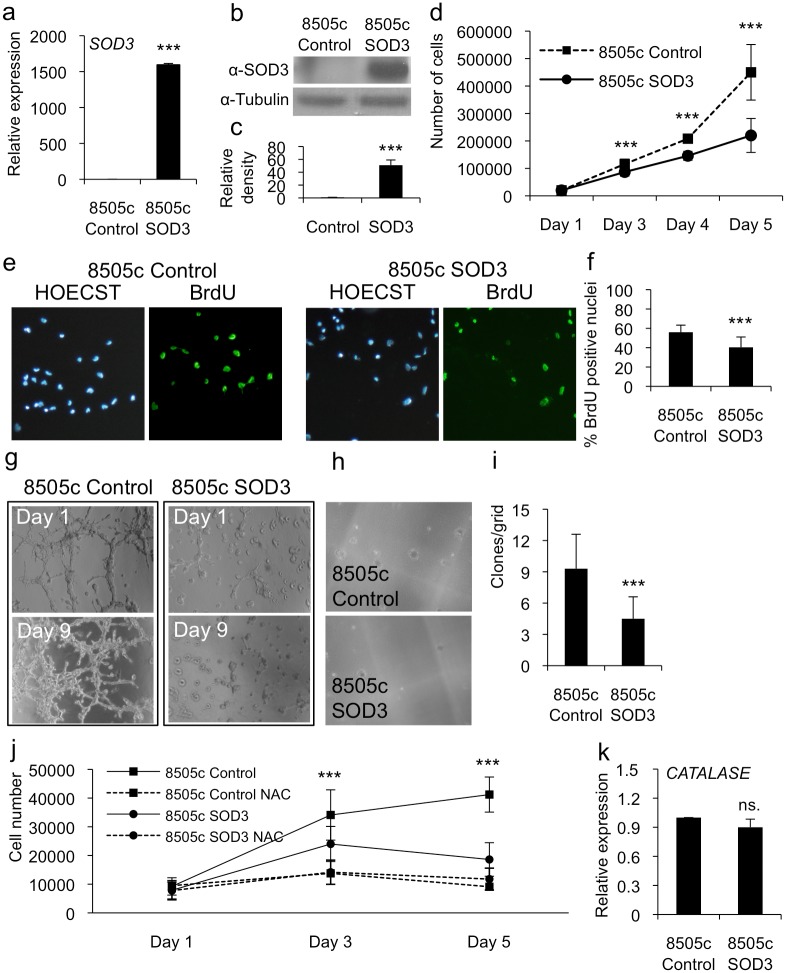
Fig 1. Robust SOD3 expression reduced anaplastic thyroid cancer cell growth.
(a) Real time RT-PCR analysis showed a high-level mRNA production of SOD3 transgene in anaplastic thyroid cancer 8505c cells. (b,c) Western blotting and related band intensity analysis showed high-level SOD3 production caused by SOD3 transgene. (d) The growth curve analysis suggested significantly (p<0.001) decreased cell numbers in cells transfected with SOD3. (e,f) The BrdU DNA incorporation analysis confirmed significantly (p<0.001) decreased cellular growth caused by SOD3. (g) The 3-D gel invasion assay suggested almost complete lack of invasive capacity of 8505c SOD3 cells. (h,i) The soft agar analysis showed significantly (p<0.001) reduced formation of colonies suggesting decreased anchorage independent growth ability for SOD3 cells as compared to 8505c control vector transfected cells. (j) The growth curve analysis of control and SOD3 cells in the presence of 2.5 mM N-Acetyl-cysteine (NAC) showed growth reduction both in 8505c control and SOD3 expressing cells upon the treatment. (k) CATALASE mRNA expression. The quantitative RT-PCR showed no difference between 8505c control and SOD3 cells in CATALASE expression. Data are expressed as mean ±SD. The p-values (* = p<0.05, ** = p<0.01, *** = p<0.001).

