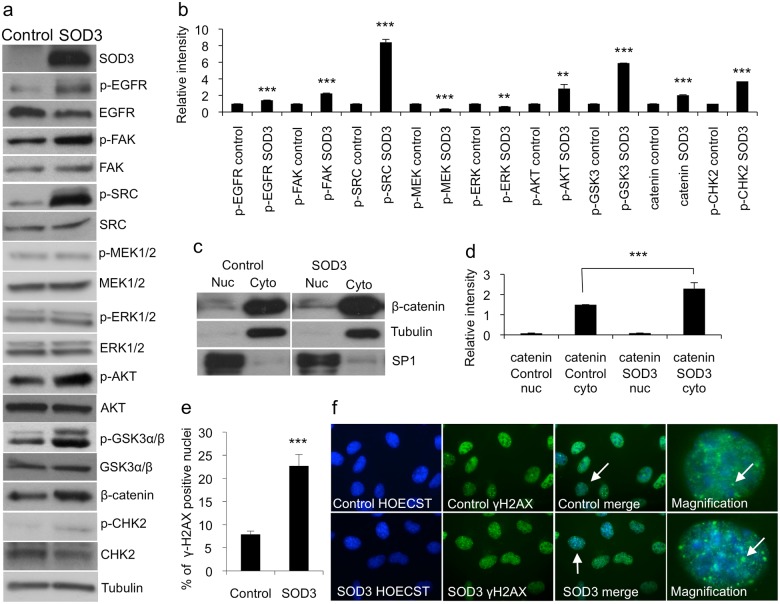
Fig 3. Western blotting and DNA damage response analysis.
(a,b) Western blotting analyses supported the protein array data showing the increased activation of RTKs and non-receptor kinases in the SOD3-transfected 8505c cells. Note, MEK1/2 and ERK1/2 phosphorylation was moderately downregulated based on the band density analyses. (c,d) Western blotting and the related band intensity analysis for β-catenin nuclear and cytosolic proteins showed significantly (p<0.001) increased β-catenin production in cytosolic compartment. Tubulin was used to normalize cytosolic proteins and SP1 was used to normalize nuclear proteins. (e,f) γH2AX staining for 8505c cells suggested significantly (p<0.001) increased histone H2AX phosphorylation, suggesting DNA damages in 8505c SOD3 cells, which supported the increased CHK2 phosphorylation observed in protoarray and in the Western blotting. The white arrows in the control and the SOD3 merge panels indicate cells that are magnified to detect the nuclear foci. The white arrows in the control and the SOD3 magnification images indicate the nuclear foci. Data are expressed as mean ±SD. The p-values (* = p<0.05, ** = p<0.01, *** = p<0.001).

