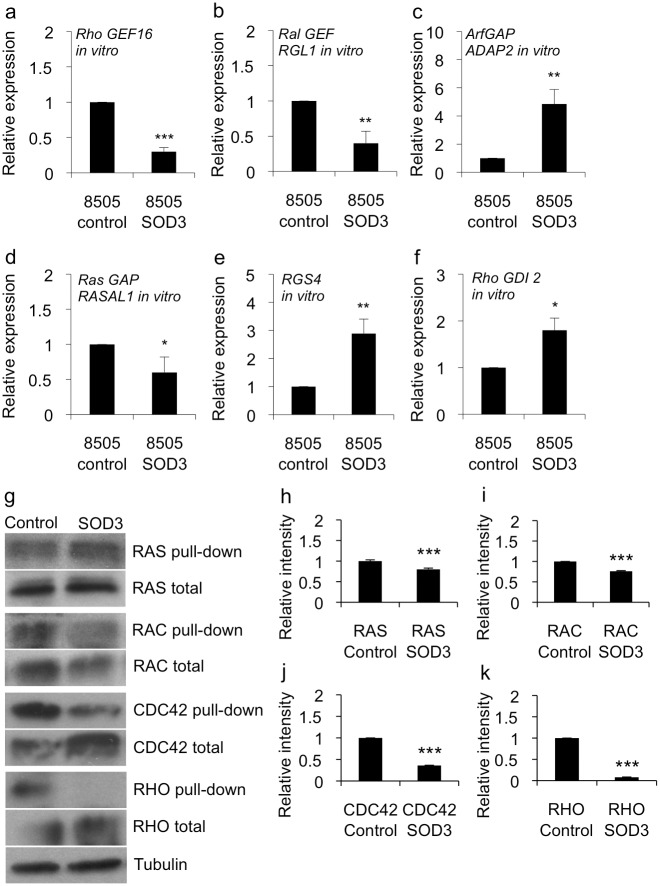
Fig 4. SOD3 regulated the expression of small GTPase regulatory genes and affected the activation of small GTPases.
(a-f) Quantitative RT-PCR for GTPase superfamily regulatory genes. The panels show the expression levels of the regulatory genes in vitro cultured cells containing high-level SOD3 mRNA and reduced growth abilities. (g-k) Pull-down assay for small GTPase proteins RAS, RAC, CDC42, and RHO. The assay suggested significantly (p<0.001) reduced GTP loading to each tested GTPase therefore being in line with reduced cell proliferation, migration, and growth related signal transduction. Data are expressed as mean ±SD. The p-values (* = p<0.05, ** = p<0.01, *** = p<0.001).

