
Figure 3.
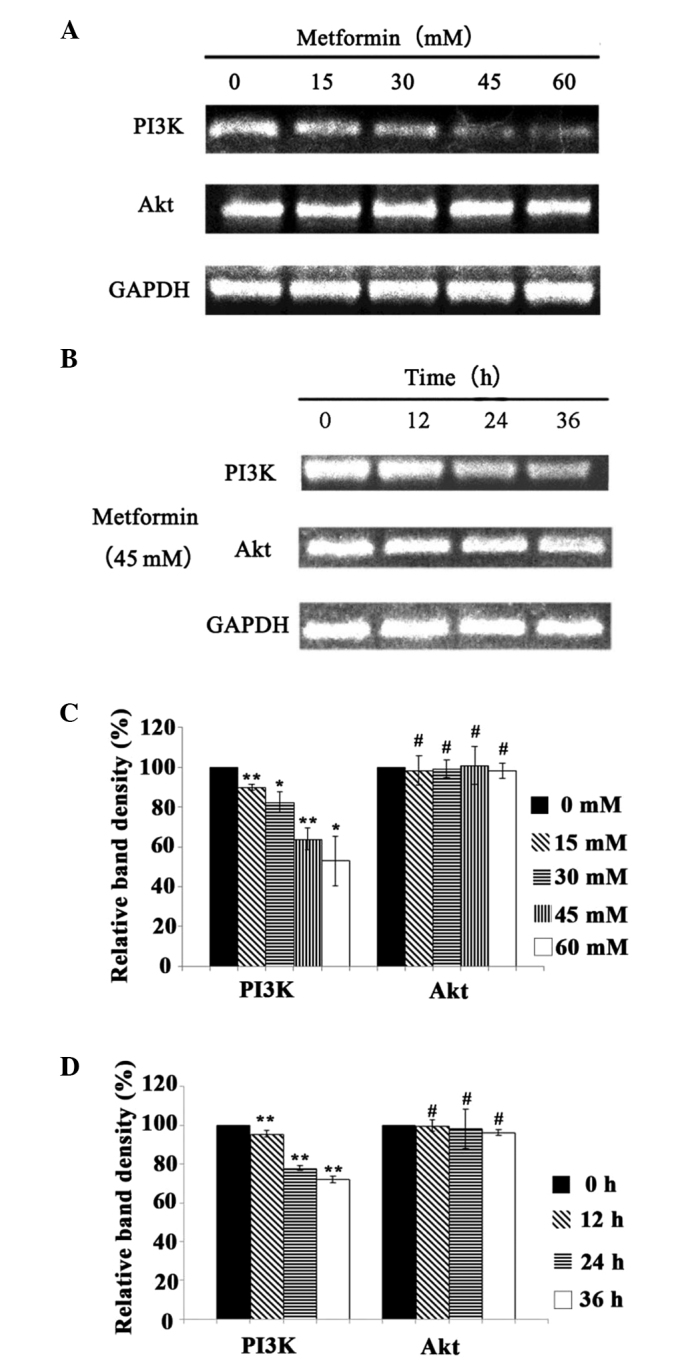
mRNA expression levels of PI3K and Akt in A431 cells following metformin treatment. The mRNA expression levels of PI3K and Akt in A431 cells treated with (A and C) 0, 15, 30, 45, 60 mM metformin for 24 h and (B and D) 45 mM metformin for 12, 24 and 48 h. The mRNA levels of PI3K and Akt were detected by reverse transcription-polymerase chain reaction. The relative optical density for mRNA was measured using Image J software, with GAPDH as an internal reference. All data, repeated by three independent experiments, are presented as mean ± standard deviation. *P<0.05, **P<0.01 and #P>0.05 vs. control group.