
Figure 4.
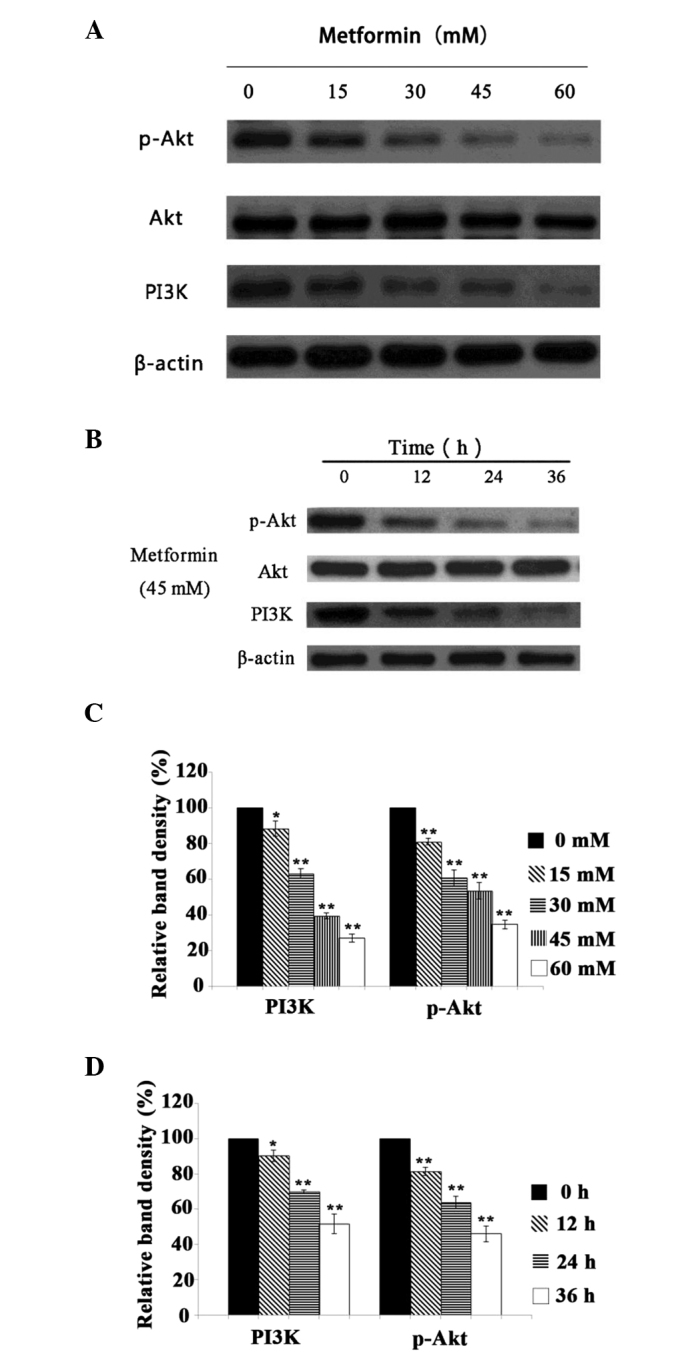
Protein expression levels of PI3K and phosphorylated-Akt in A431 cells following metformin treatment. Protein expression levels of PI3K and phosphorylated-Akt in A431 cells treated with (A and C) 0, 15, 30, 45, 60 mM metformin for 24 h and (B and D) 45 mM metformin for 0, 12, 24 and 36 h. The protein levels of PI3K and phosphorylated-Akt were detected by western blot analysis. The optical density of the protein was measured using Image J software, with β-actin as an internal reference. All data, repeated by three independent experiments, are presented as mean ± standard deviation. *P<0.05 and **P<0.01 vs. control group.