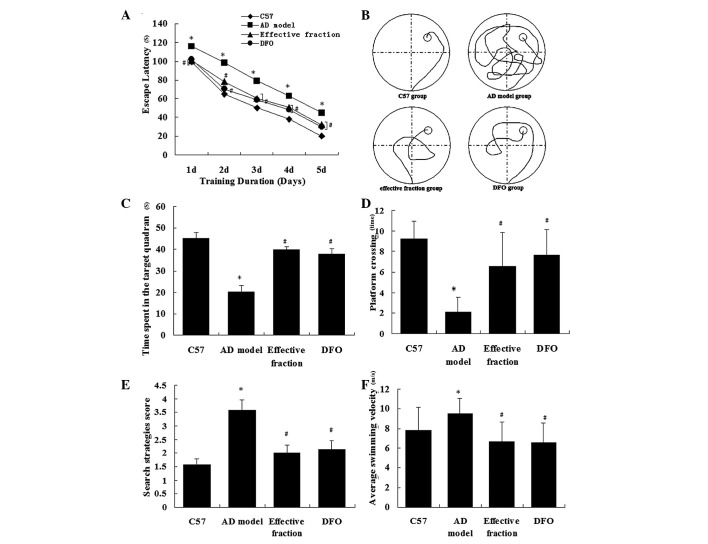
Figure 2.
Behavioral performance of animals in the Morris water maze. (A) Average escape latencies. (B) Representative swimming paths on day 5 of the place navigation trial were recorded with a video tracking system. (C) Percentage time spent in the quadrant that previously contained the platform. (D) Search strategies score. (E) Number of crossings to the previous location of the platform. (F) Average swimming velocity during the spatial probe trial. Data are presented as the mean ± standard error (n=10 per group). *P<0.01 vs. C57 and #P<0.01 vs. AD model groups. AD, Alzheimer’s disease; DFO, deferoxamine.

