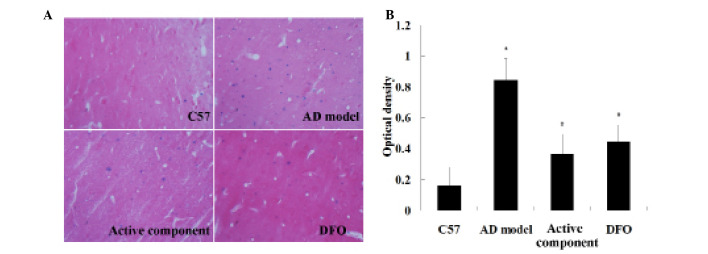
Figure 4.

Treatment with the active components reduces the iron load in the APP/PS1 mouse brain. (A) Micrographs of prepared brain tissue display the iron load in the mouse brain. Fewer blue spots were observed in the active component and DFO group mice compared with the AD model group mice. Fewer blue spots were observed in the C57 group mice. (B) Quantification of the blue spots indicated that iron load was reduced in the active component and DFO group mice compared with those in the AD model group mice (n=10 per group). *P<0.01 vs. C57 and #P<0.01 vs. AD model groups. AD, Alzheimer’s disease; DFO, deferoxamine.
