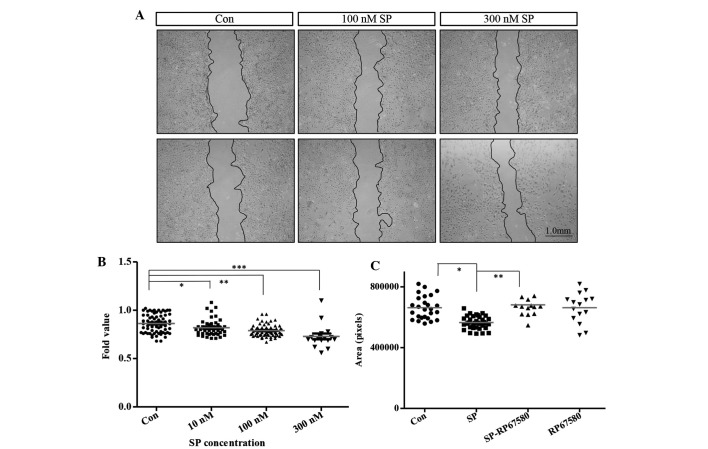
Figure 2.
SP induces the mobilization of ST2 cells. (A) Representative images (scale bar, 1.0 mm) and (B) wound area measurement 9 h after SP treatment (10, 100 and 300 nM). Three independent experiments were performed and data are shown as the mean ± standard error of mean. Con (0 nM SP), n=68; 10 nM SP, n=45; 100 nM SP, n=70; 300 nM SP, n=17. *P<0.0001, **P<0.0148 and ***P<0.0001. (C) Wound area measurement 9 h after 300 nM SP treatment with or without 10 μM RP67580. Data are shown as the mean ± standard deviation. Con (0 nM SP), n=26; SP, n=35; SP-RP67580, n=14; RP67580, n=15. *P<0.0001 and **P<0.0001. Con, control; SP, substance P.

