
Figure 1.
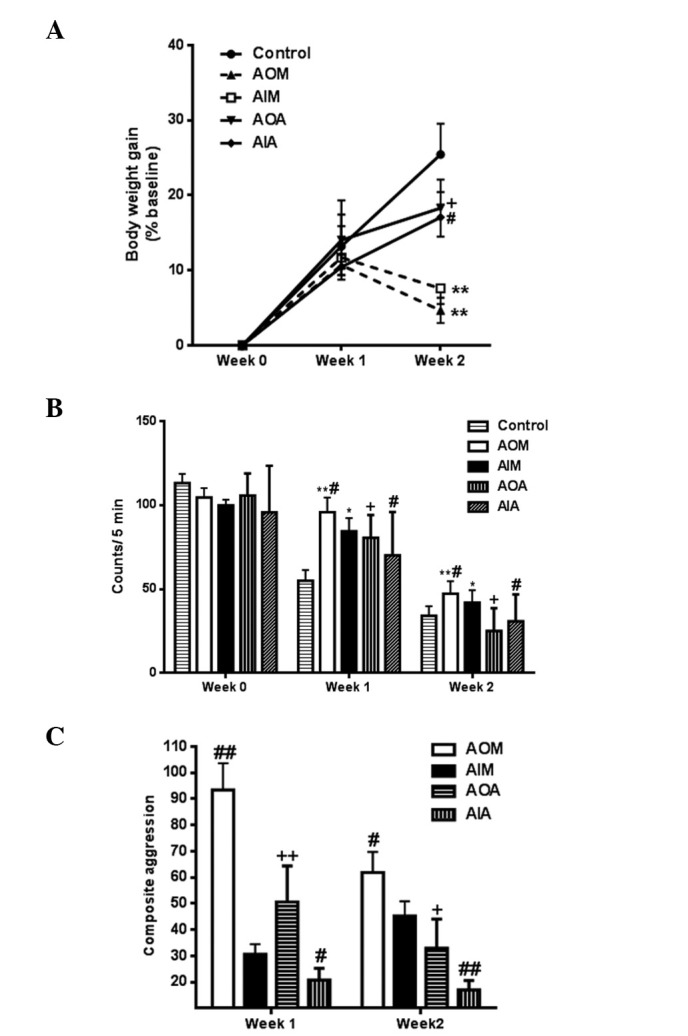
Tests using the rat model. (A) Comparison between the weights of the rats prior to and following model establishment. (B) Comparison of the open-field test scores of different groups. (C) Comparison of the aggression scores of the rats in the different groups. AIM, anger-in model; AOM, anger-out model.*P<0.05 and **P<0.01, as compared with the control group; #P<0.05 and ##P<0.01, as compared with the AIM group. +P<0.05 and ++P<0.01, as compared with the AOM group.