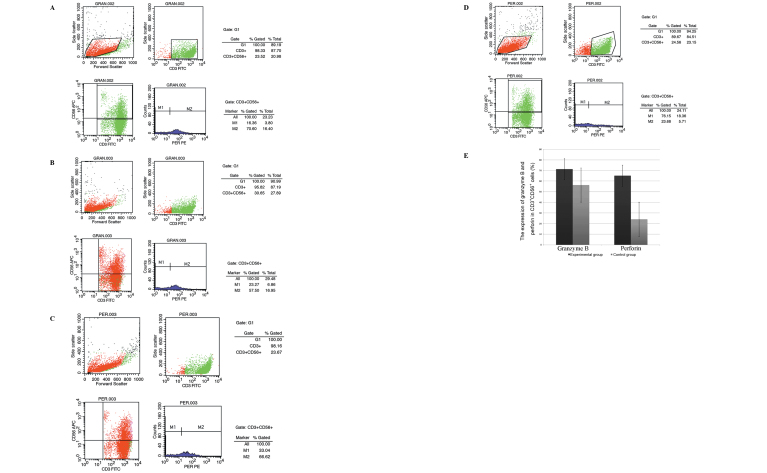
Figure 3.
The mean numbers of granzyme B-positive cells and perforin-positive cells expressed in CD3+CD56+ cells in the experimental (rituximab) group were higher than those in the control group (P<0.05). (A) Granzyme B (experimental group; 71.25±21.65%); (B) granzyme B (control group; 56.29±16.99%); and (C) perforin (experimental group; 65.08±17.47%). FITC, fluorescein isothiocyanate; PE, phycoerythrin. The mean numbers of granzyme B positive cells and perforin positive cells expressed in CD3+CD56+ cells in the experimental (rituximab) group were higher than those in the control group (P<0.05). (D) Perforin (control group; 20.05±6.97%); (E) the mean percentages of granzyme B and perforin expressed in CD3+CD56+ cells. FITC, fluorescein isothiocyanate; PE, phycoerythrin.

