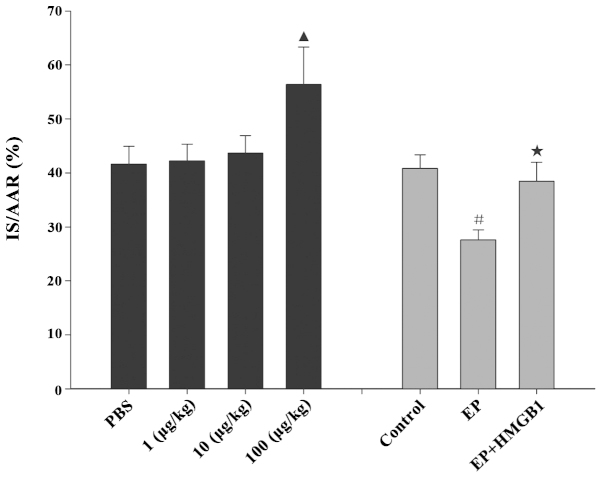
Figure 1.
IS in rat hearts subjected to 30 min occlusion and 48 h reperfusion. PBS represents the PBS treatment group, while 1, 10 and 100 μg/kg represent the escalating concentrations of rhHMGB1 administered in the groups. The EP group was administered EP at 40 mg/kg, while the EP + HMGB1 group was administered EP at 40 mg/kg and rhHMGB1 at 100 μg/kg. Data are presented as the mean ± standard error; n=6–8 rats in all groups. Data for the sham group are not presented as the group did not undergo ischemia. ▲P>0.05 vs. the PBS group; #P<0.05 vs. the control group; *P<0.05 vs. the EP group. IS/AAR, ratio of infarct size to area at risk; PBS, phosphate-buffered saline; EP, ethyl pyruvate; rhHMGB1, recombinant human high-mobility group box-1.

