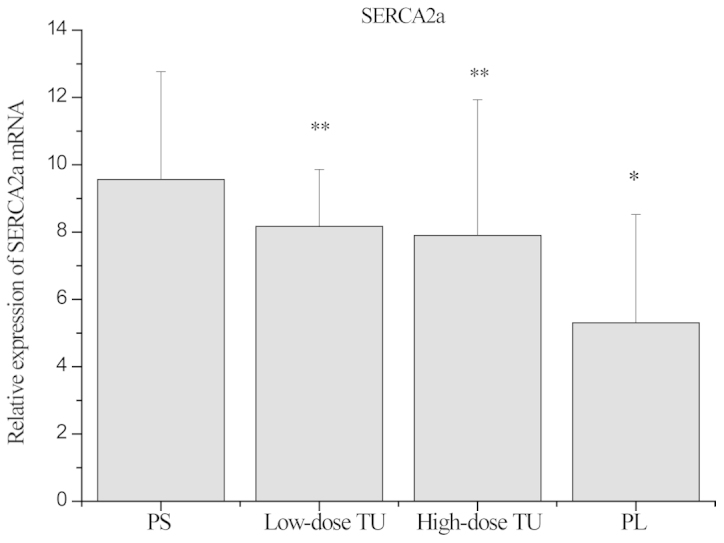
Figure 3.

Relative expression of sarcoendoplasmic reticulum Ca2+-ATPase 2a (SERCA2a) mRNA in myocardial tissue in each group as determined by reverse transcription-quantitative polymerase chain reaction. *P<0.05, compared to the PS group; **P<0.05, compared to the PL group. PS, pseudosurgery; TU, testosterone; PL, placebo.
