
Figure 2.
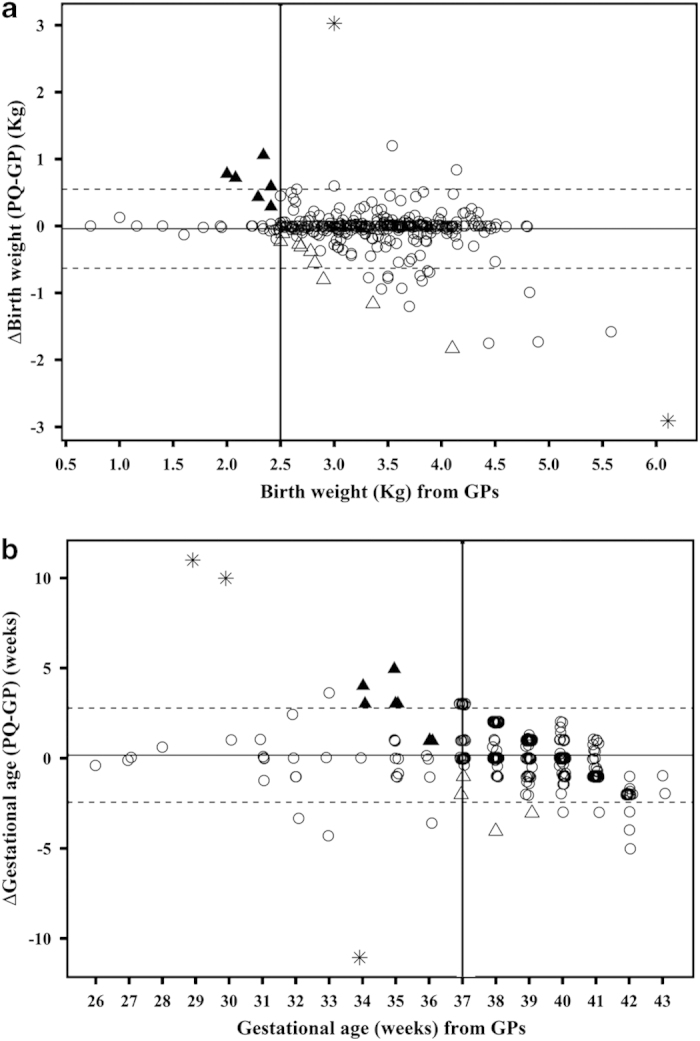
Difference in (a) birthweight and (b) gestational age between PQ and GP data versus GP data. For clarity, GP data were used as baseline and are thus plotted on the x axis, rather than the mean of GP and PQ data. Solid horizontal line represents the bias (i.e., mean difference) of the two methods, whereas dotted lines represent the 95% limits of agreement (LoA) between the two methods. Bold solid vertical lines indicate critical cutoffs of <2.5 kg and <37 weeks, which were used to categorise children having low birth weight or born preterm, respectively, according to GPs. ▲ symbols indicate children who would have been ‘misclassified’ as having normal birth weight (n=6) or born full term (n=8) if based on PQs rather than GP records. Δ symbols indicate children who would be potentially ‘misclassified’ as having low birth weight (n=11) or born preterm (n=4) if based on PQs rather than GP data. The outliers indicated by *, which obviously indicate misreporting by either PQ or GPs, have been excluded from the analyses. GP, general practitioner; PQ, parental questionnaire.