
Figure 3.
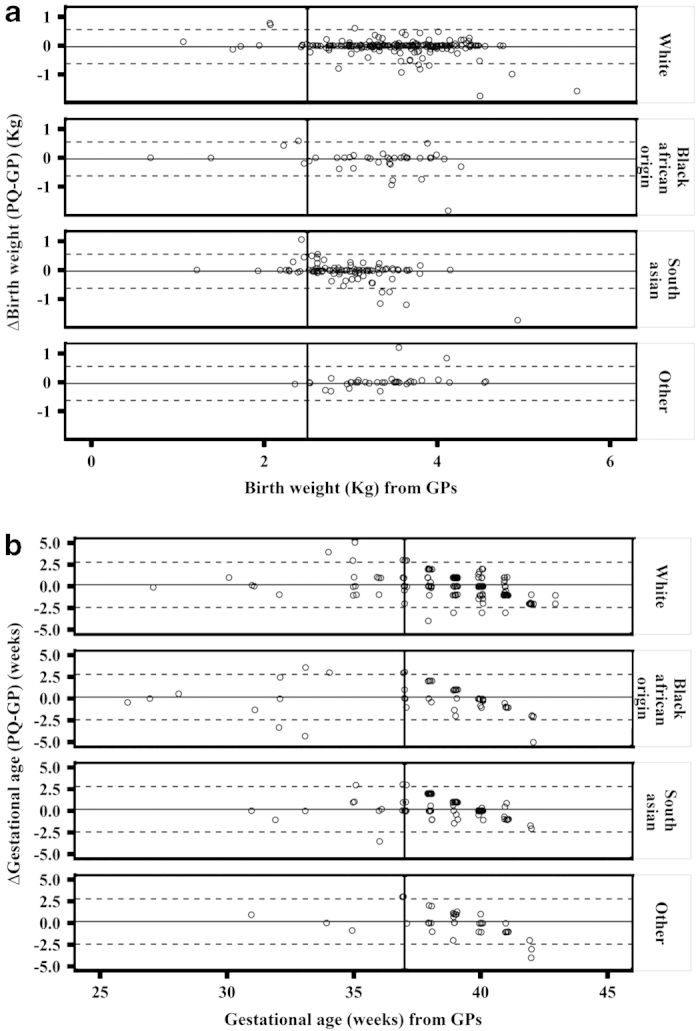
Differences between PQ and GP data with respect to (a) birth weight and (b) gestational age according to ethnicity. Solid horizontal lines represent the bias (i.e., mean difference) between the parental and GP data. Dashed lines represent the 95% limits of agreement between the two methods for the overall population. Bold solid vertical line indicates critical cutoffs of <2.5 kg for BW and <37 weeks for GA, which were used to categorise children who were having low birth weight or born preterm according to GPs. Points indicating extreme misclassification were excluded from this plot and analyses. GA, gestational age; GP, general practitioner; PQ, parental questionnaire.