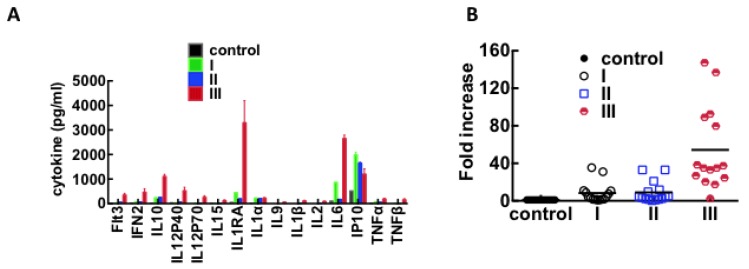
Figure 6.
Plot of cytokines that are differentially upregulated in plasma from classes I, II, and III HPCS patients. (A) Duplicate samples of pooled plasma (day 0, n = 5 for classes I and II; n = 4 for class III) were analyzed using a Millipore HCYTMAG-60K-PX41 Cytokine kit. Significant increases in cytokine expression were determined by a two-way ANOVA with a Bonferroni's multiple comparison test; (B) The data from (A) were recast as fold increase above normal expression levels.

