. 2015 Feb 16;4:e03614. doi: 10.7554/eLife.03614

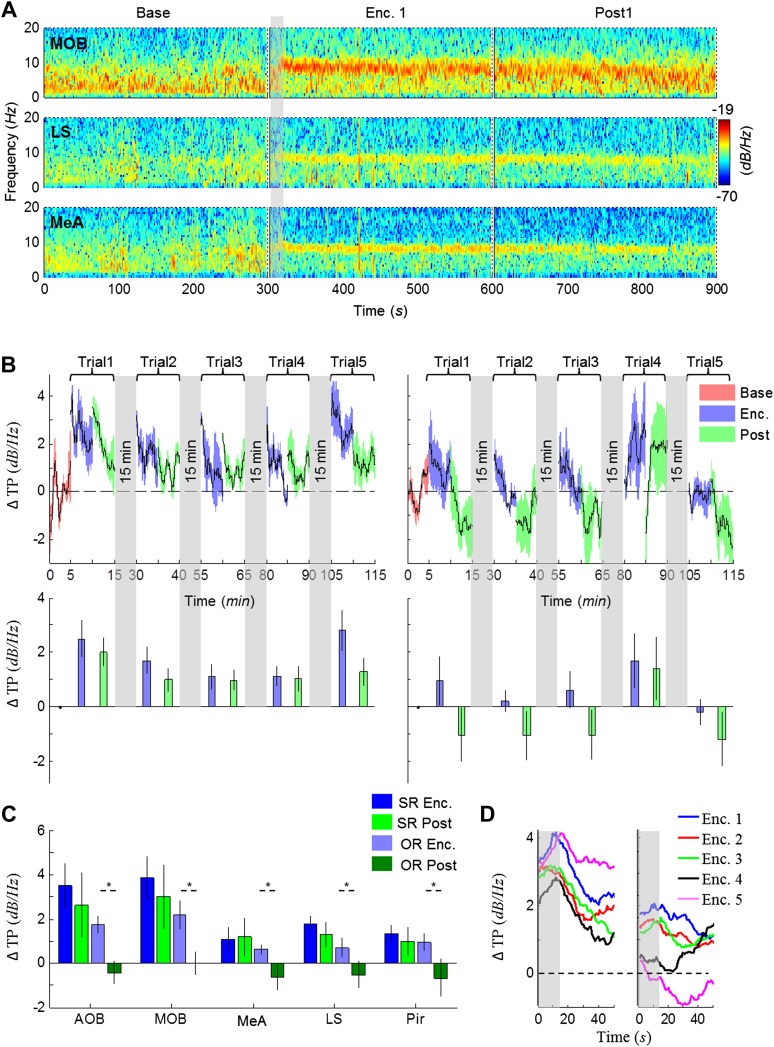
Figure 4. Modulation of the theta rhythmicity by social stimulus novelty reflects an internal state in the brain.

(A) Color-coded spectrograms of the LFP recorded in the MOB (upper), LS (middle), and MeA (lower) for 5 min before (Base), during (Enc. 1), and after (Post 1) the first encounter of the SRM test. All spectrograms are averages of five animals (4 animals for LS). Gray bar marks the 15 s needed for stimulus transfer to the arena. (B) Upper—instantaneous ΔTP (change from mean Base) in the LS averaged over four rats (±SEM) during the Enc. and Post periods of all trials (1-5), for social (left, n = 5) and object (right, n = 4) paradigms. The 15-min breaks between last Post and next Enc. periods are labeled with gray bars. Lower—mean (±SEM) values for the corresponding periods shown above. (C) Comparison of mean ΔTP averaged over all trials (1-5) for each brain area, between the Enc. and Post periods of the social and object paradigms (*p < 0.05, paired t-test, Figure 4—source data 1). (D) Left—the instantaneous ΔTP shown in B, expanded to show the initial 50 s of all encounters. Gray area represents the 15 s needed for stimulus transfer to the experimental arena. Right—The same for object stimuli.

DOI: http://dx.doi.org/10.7554/eLife.03614.009

Figure 4—source data 1. Comparison of ΔTP between Enc. and Post periods.
Paired t-tests were used to compare between the mean ΔTP across Enc. vs the mean ΔTP across Post periods. The assumption of normality was assessed by Lilliefors and Shapiro–Wilk tests.
elife03614s003.docx (22KB, docx)
DOI: 10.7554/eLife.03614.010

Figure 4.

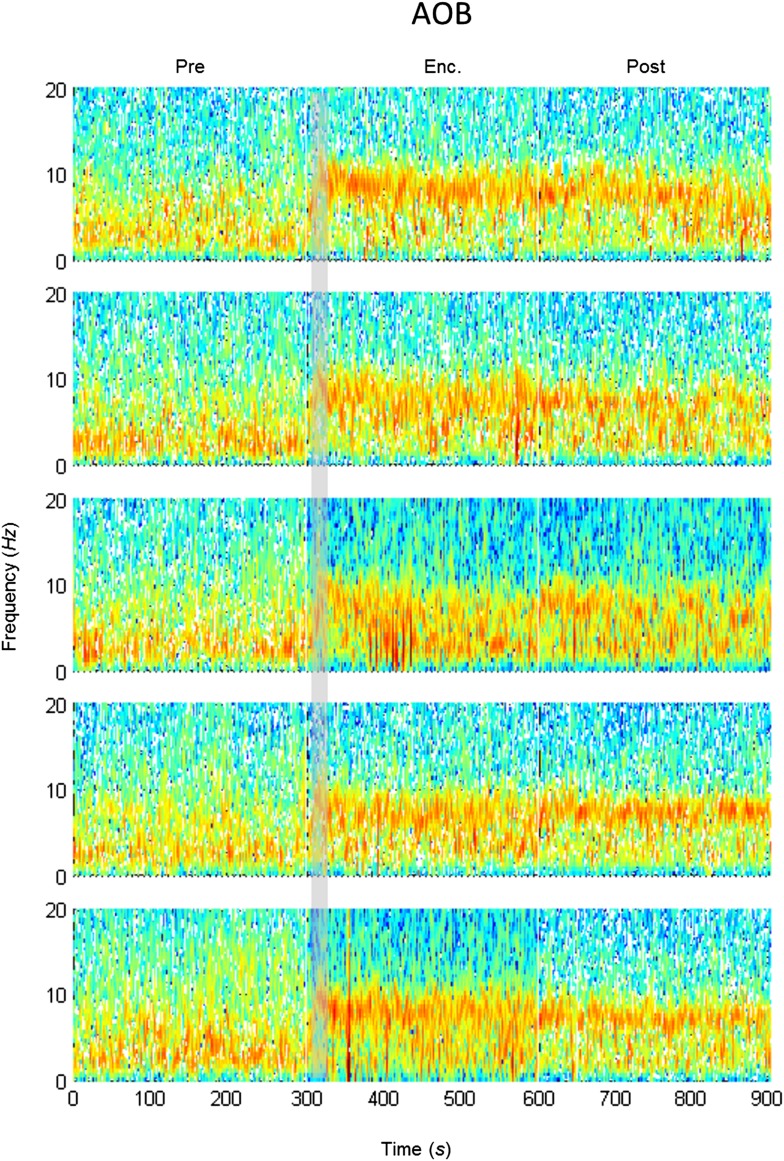
Figure 4—figure supplement 1. Mean LFP spectrograms across the SRM paradigm for the AOB.

Figure 4—figure supplement 1.

Color-coded spectrograms (0–20 Hz) of the LFP recorded in the AOB during the SRM test. Gray bar marks the 15 s needed for stimulus delivery to the arena. Mean of five animals.
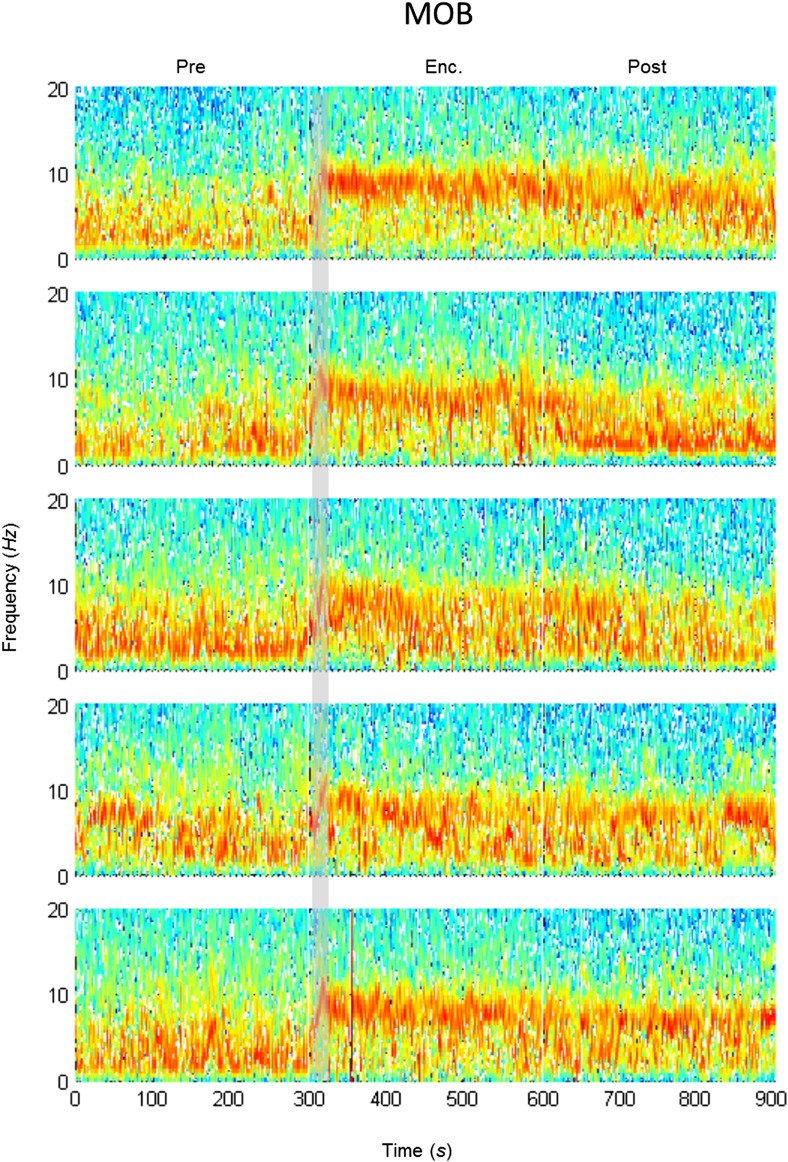
Figure 4—figure supplement 2. Mean LFP spectrograms across the SRM paradigm for the MOB.

Figure 4—figure supplement 2.

Color-coded spectrograms (0–20 Hz) of the LFP recorded in the MOB during the SRM test. Gray bar marks the 15 s needed for stimulus delivery to the arena. Mean of five animals.
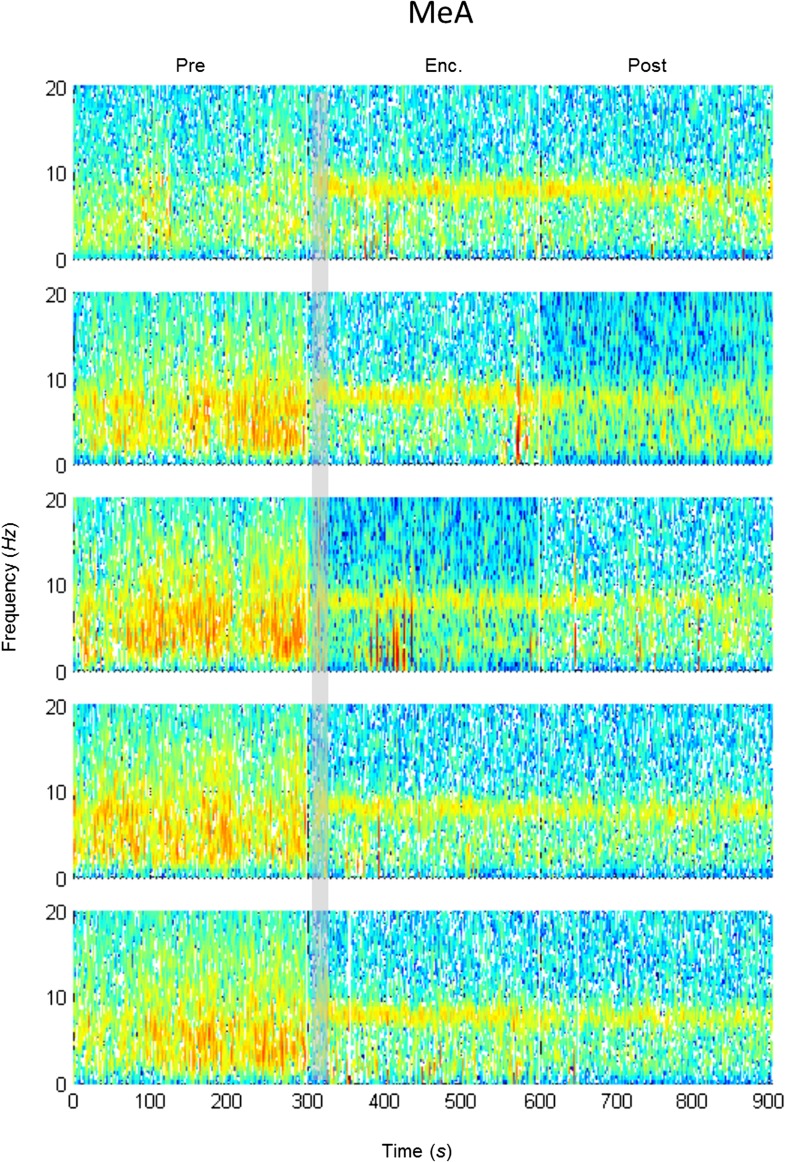
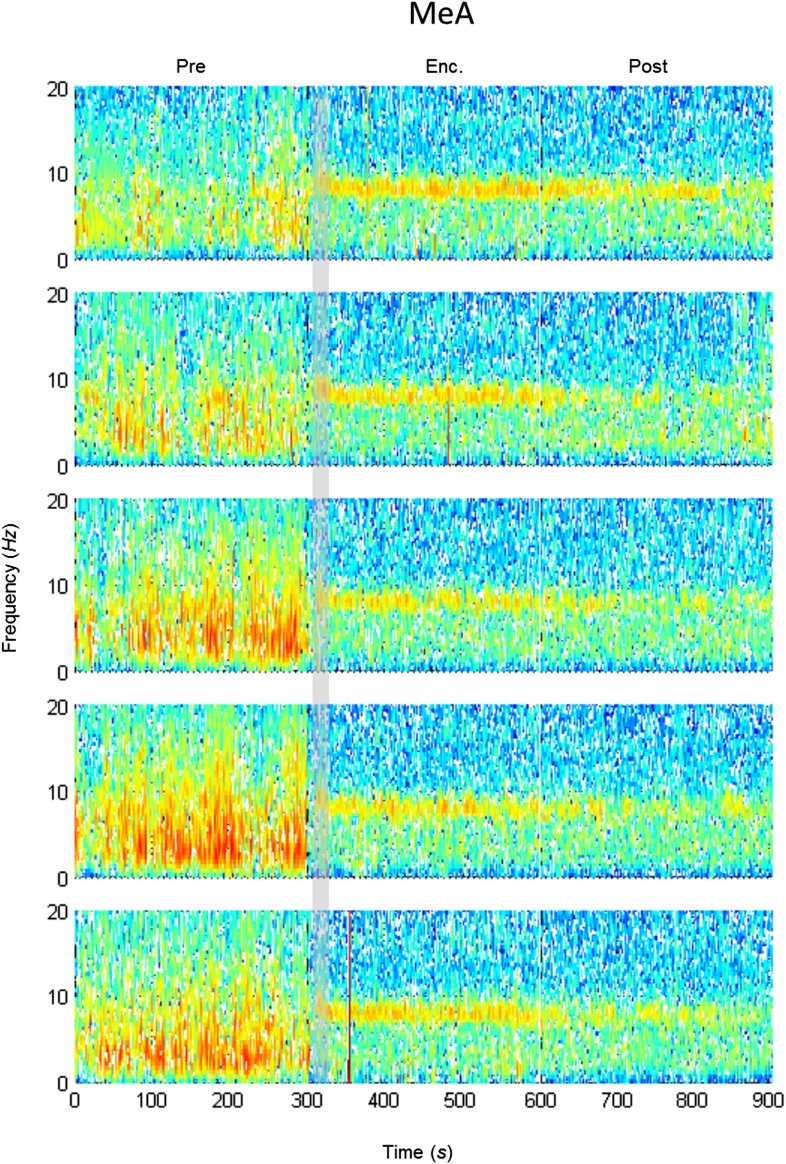
Figure 4—figure supplement 3. Mean LFP spectrograms across the SRM paradigm for the MEA.

Figure 4—figure supplement 3.

Color-coded spectrograms (0–20 Hz) of the LFP recorded in the MEA during the SRM test. Gray bar marks the 15 s needed for stimulus delivery to the arena. Mean of five animals.
Figure 4—figure supplement 4. Mean LFP spectrograms across the SRM paradigm for the LS.

Figure 4—figure supplement 4.

Color-coded spectrograms (0–20 Hz) of the LFP recorded in the LS during the SRM test. Gray bar marks the 15 s needed for stimulus delivery to the arena. Mean of four animals.
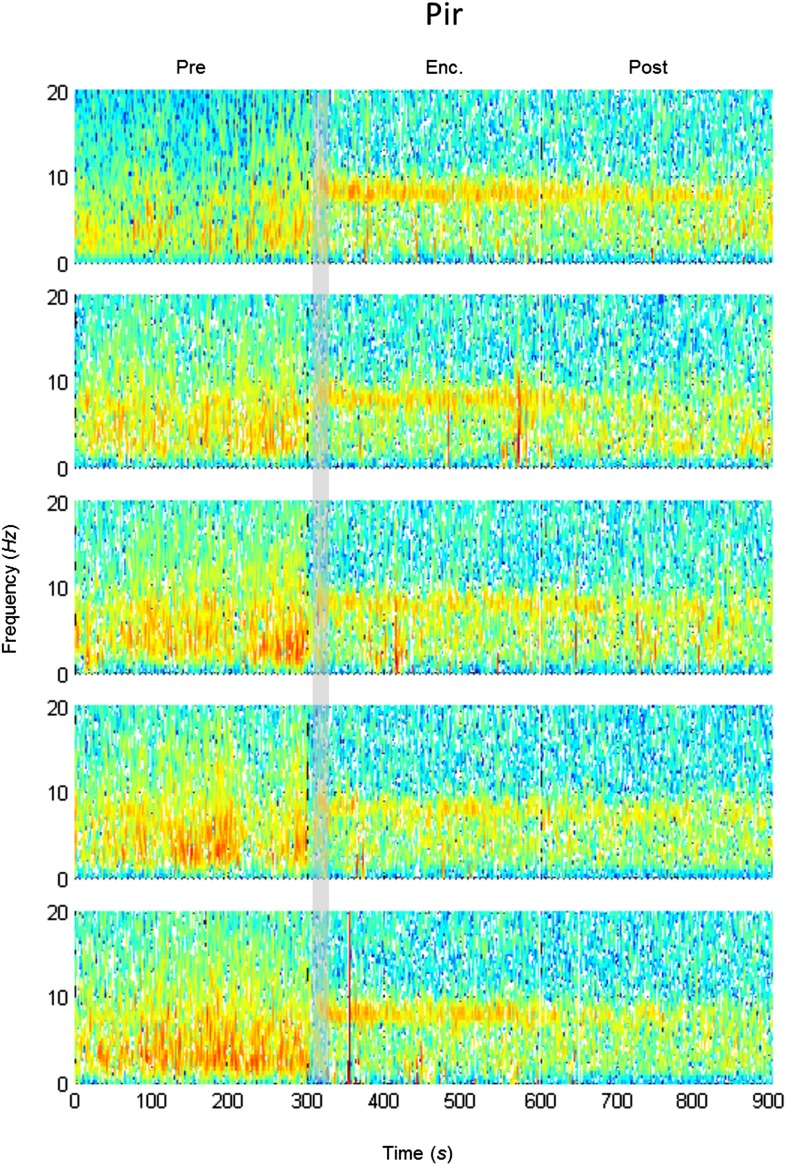
Figure 4—figure supplement 5. Mean LFP spectrograms across the SRM paradigm for the Pir.

Figure 4—figure supplement 5.

Color-coded spectrograms (0–20 Hz) of the LFP recorded in the Pir during the SRM test. Gray bar marks the 15 s needed for stimulus delivery to the arena. Mean of five animals.
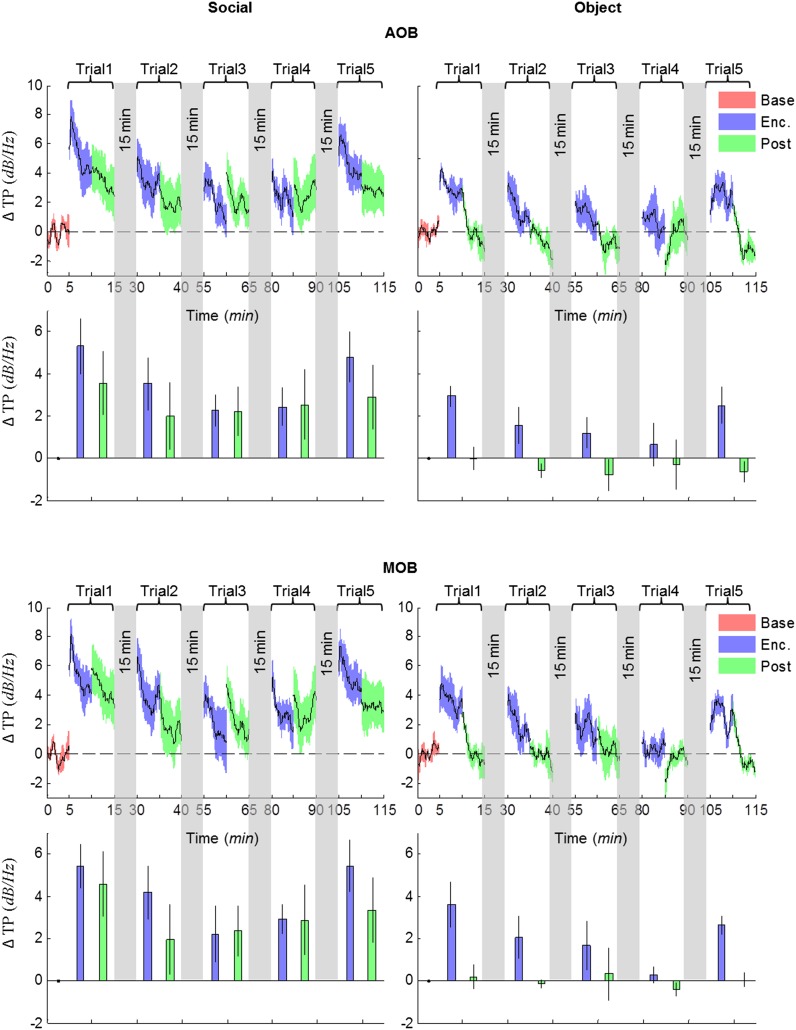
Figure 4—figure supplement 6. Comparison of mean instantaneous TP between social and object stimuli, for the AOB and MOB.

Figure 4—figure supplement 6.

Upper panels—instantaneous ΔTP (change from mean Base) in each brain area averaged over all animals (mean ± SEM) during the Enc. and Post periods of all trials (1–5), for social (left, n = 5 rats) and object (right, n = 4 rats) paradigms. The 15-min breaks between last Post and next Enc. periods are labeled with gray bars. Lower panels—mean (±SEM) values for the corresponding periods shown above.
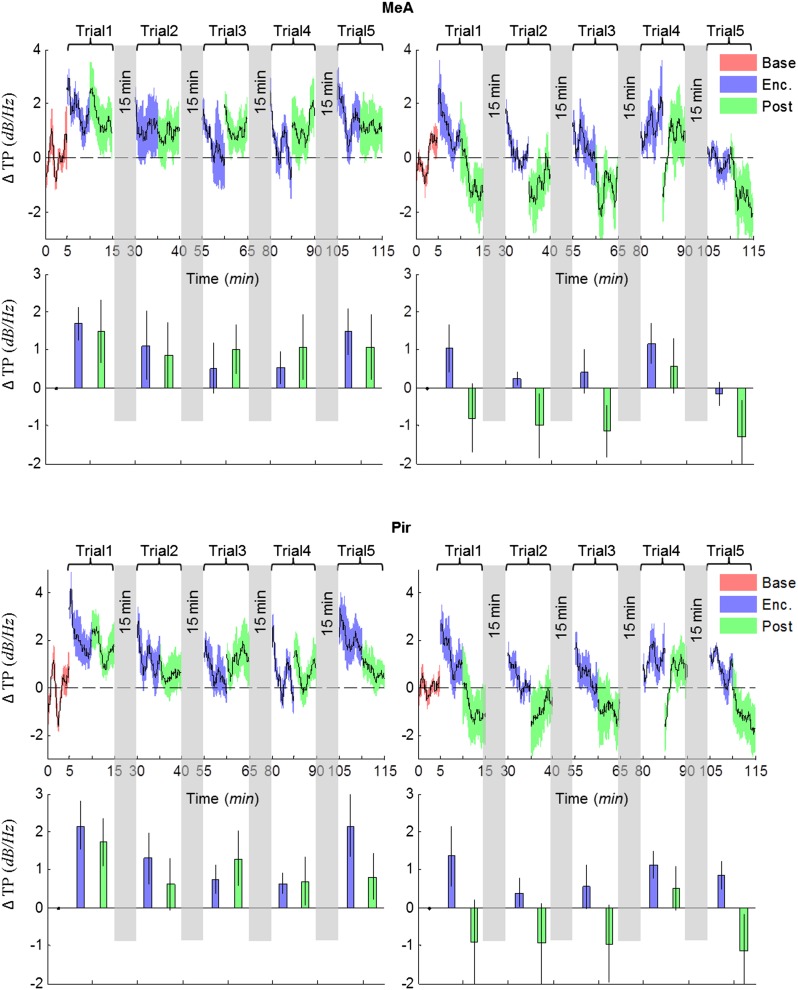
Figure 4—figure supplement 7. Comparison of mean instantaneous TP between social and object stimuli, for the MeA and Pir.

Figure 4—figure supplement 7.

Upper panels—instantaneous ΔTP (change from mean Base) in each brain area averaged over all animals (mean±SEM) during the Enc. and Post periods of all trials (1–5), for social (left, n = 5 rats) and object (right, n = 4 rats) paradigms. The 15 min breaks between last Post and next Enc. periods are labeled with gray bars. Lower panels—mean (±SEM) values for the corresponding periods shown above.