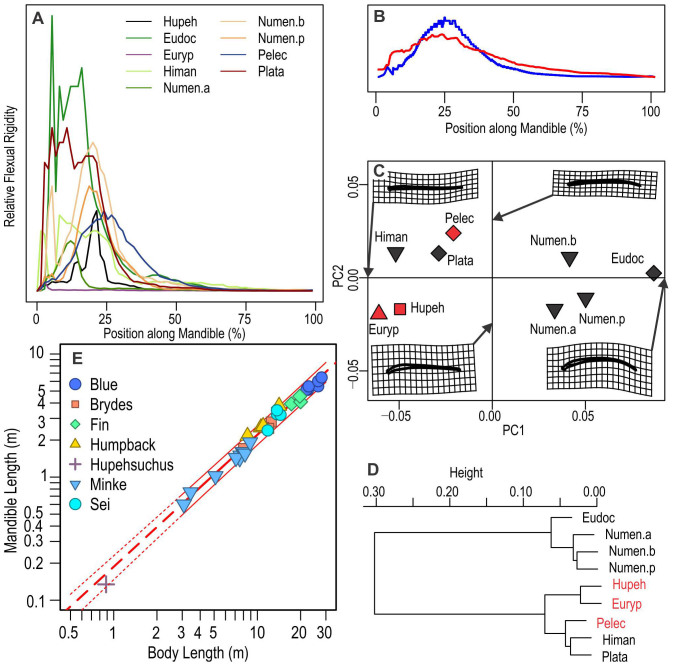
Figure 3. Comparison of jaw shape and flexural rigidity.
(A), distribution of relative flexural rigidity along the mandible, based on the biquadratic of relative depths; (B), comparison of estimated relative flexural rigidity (blue) with a published curve (red) in the brown pelican; (C), first two axes of PCA from a geometric morphometric analysis; (D), hierarchical cluster analysis of data used in (C); (E), phylogenetic regression of mandible versus body length in rorqual whales, with extrapolation for Hupehsuchus. Symbols in (C): diamond, Pelecaniformes; reverse triangle, Scolopacidae; square, Hupehsuchus; and triangle, Osteichthyes. (A), (C), and (D) demonstrate a close similarity between extant lunge feeders and Hupehsuchus in jaw shape and the flexibility it implies. Red text highlights taxa that are judged to be lunge feeders. Thick red regression line in (E) is based on PGLS through species means, although points represent individual specimens. Thin curves associated with the PGLS line are based on OLS regression. See text and Methods.

