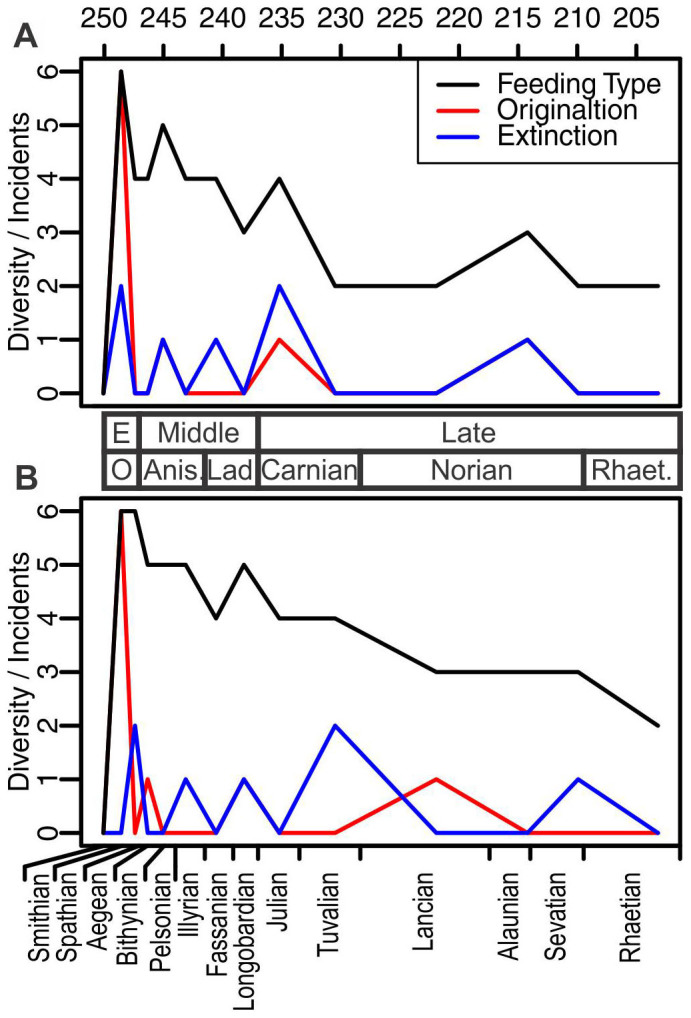
Figure 4. Feeding type diversity of marine tetrapods through the Triassic.

(A), raw data from Supplementary Table S1; (B), modified data to account for the incompleteness of fossil record. See text. Both graphs show the burst of feeding types in the Early Triassic, followed by a decline. Numbers on the top represent the absolute age (million years ago). Names between (A) and (B) are epochs and ages of the Triassic, and those at the bottom are substages.
