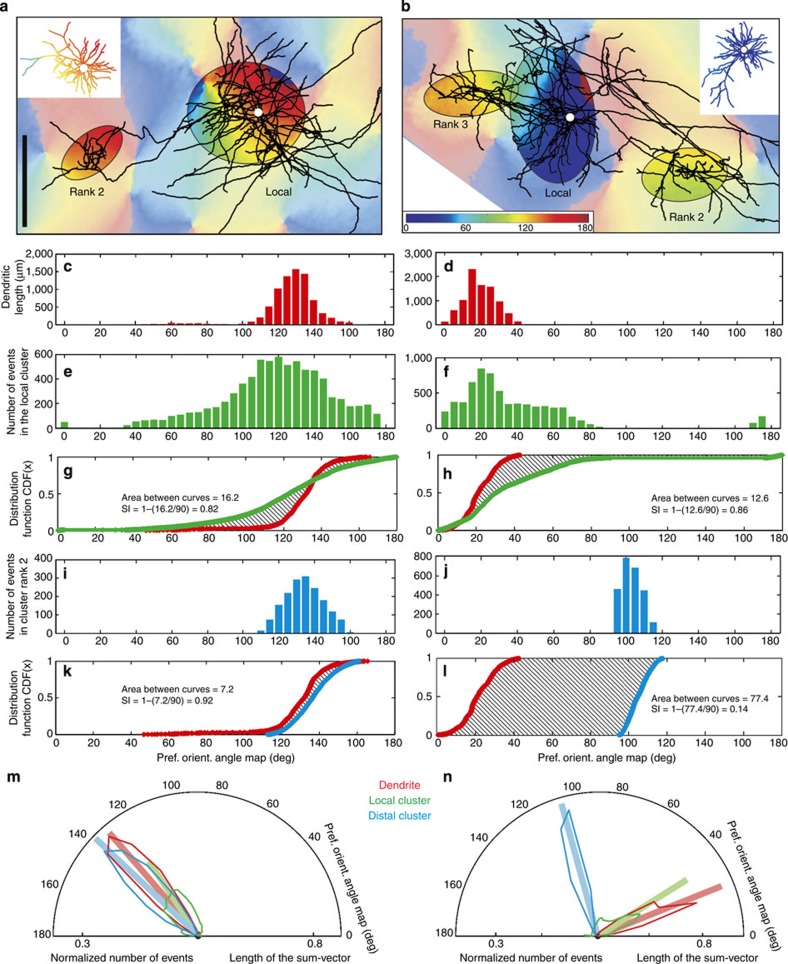
Figure 2. Calculation of the Similarity Index (SI) with the cumulative distribution function (CDF)-method exemplified with two contrasting neurons (left and right columns).
(a,b) Axon and orientation map. For clarity, boutons were removed and only ellipses shown for the local cluster (rank 1) and the superficial layer clusters (ranks indicated). Dendritic trees (insets) were colour coded by the orientation value of their corresponding pixels (soma=white dot). Scale bar, 0.5 mm. (c,d) Histogram of the pixel’s orientation values underlying the dendritic tree (insets in a and b). (e,f) Histogram of orientation pixel values for the region enclosed by a local cluster ellipse. (i,j) Equivalent histogram for one distal ellipse (rank 2). (g,h) CDF for dendrites (red) and local ellipse (green). Area differences between CDFs were used to calculate the SI (see text in graph). (k,l) CDF for dendrites and rank 2 distal cluster (blue). The formula for the SI is given in the graph. (m,n) Hemispheric plots were created by converting the histograms into radial values, normalized by the total number of events (coloured curves). The individual vectors forming these hemispheric plots were summed up to generate one sum-vector (bold vector). Supplementary Fig. 5 shows the sum-vectors for each of the 33 neurons. The length of this sum-vector is termed as the ‘tuning’ of the dendrite or cluster. (Neuron ID: a (11), see Fig. 1; b (17), cat_0608_RH_neuron_01. Receptive field properties: complex, ocular dominance 1, size 1.4 × 2.7°, location 0.5°/−2° from area centralis, preferred orientation 63°±47°, direction preference 153°).

