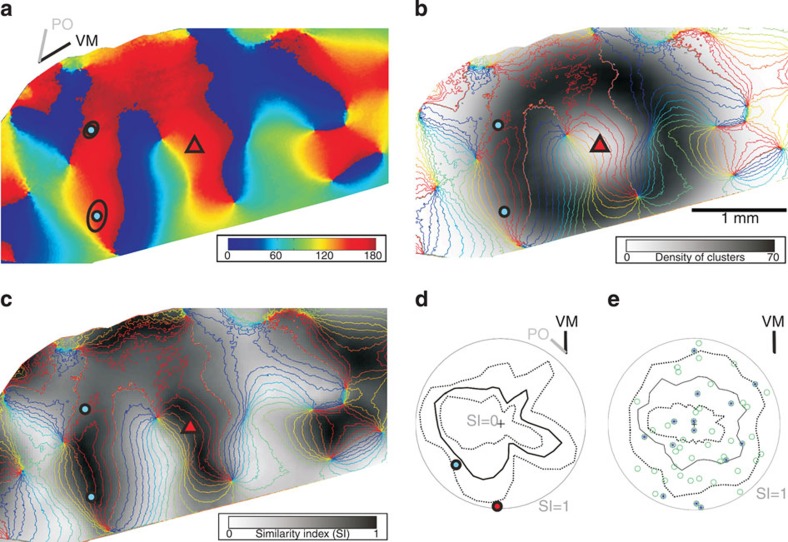
Figure 8. Bootstrapping to test whether bouton clusters were positioned randomly.
(a) Orientation map with cell soma (red triangle) and two distal cluster’s ellipses (black curves) with their centre (cyan dots). Colour code for orientation angle indicated in strip. Bars (top-left) indicate preferred orientation (PO) of the neuron and the angle of vertical meridian (VM) representation. (b) Smoothed density distribution for 20,000 bootstrapped cluster centres (see Methods) overlaid by a contour plot (10-deg intervals) of the orientation map shown in a. Greyscale values denote the cluster density. (c) 2D Similarity Index (SI) distribution after 20,000 bootstrapped clusters. The SI values are greyscale coded where black is an SI of 1 and white an SI of 0. (d) Clusters whose centres lay within the local ellipse or which fell outside the map were ignored. The remaining clusters were used to test whether actual clusters were randomly placed. Confidence intervals for each circular sector (bin width 10 degrees) centred at the cell soma were calculated for all the SIs in c. Radial distance from centre (black cross) gives magnitude of SI value (grey circumference indicates SI=1), and the circular angle denotes the sector’s orientation in space. Dashed lines denote the 5% and 95% percentile confidence intervals. The median is indicated by a solid black line. If an SI value of an actual measured cluster was outside the confidence interval boundaries (for example, red circle) the cluster placement was considered as significantly different from what would be expected from a random placement of clusters. (e) Superposition of all superficial layer distal clusters of the 25 neurons individually aligned to their vertical meridian. Clusters lying outside their confidence interval are marked with stars. (Neuron ID: 24, cat_0707_RH_neuron_01. Simple 2 RF, ocular dominance 3, size 1.4 × 1.4°, location 0.7°/−3.3° from areal centralis, preferred orientation 138°±17°, direction selective 228°, 75 MΩ). (See the same procedure exemplified for another neuron in Supplementary Fig. 10).

