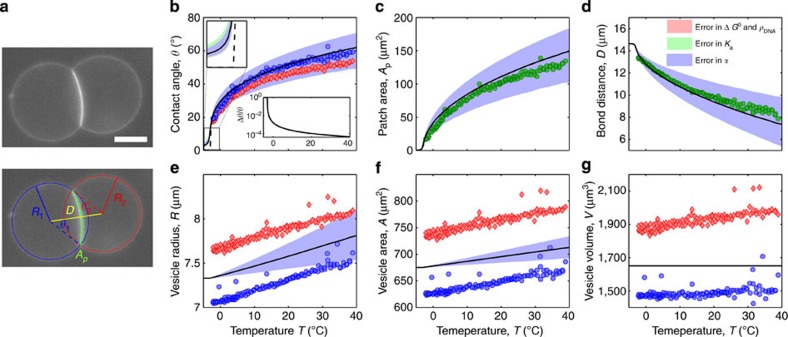
Figure 2. Temperature dependence of geometrical observables.
(a) Snapshot of a pair of adhering DNA-GUVs. Scale bar, 10 μm. In the bottom image, we highlight geometrical features as extracted by our analysis software (see Methods section). Blue and red solid lines mark the radii R1/2 of the spherical segments of the two GUVs. The slightly curved adhesion patch is marked by a green solid line. The contact angles θ1/2 are measured between the segment, of length D (yellow solid line), connecting the centres of the two vesicles, and a radius subtending the patch (red and blue dashed lines). In (b–g), we show the temperature dependence of the geometrical observables: equilibrium contact angle θ (b), adhesion patch area Ap (c), centre-to-centre distance D (d), vesicle radius R (e), vesicle total area A (f) and vesicle volume V (g) for a typical pair of adhering vesicles. Symbols indicate experimental data. Red lozenges and blue circles are used to distinguish between the two GUVs. Black solid lines indicate the model predictions calculated using the parameters in Table 1 and the fitting parameter T0=−3 °C. Shaded regions indicate the model error bars. We independently propagate the uncertainties derived from α (light blue), Ka (light green) and combine those derived from ΔH0, ΔS0 and ρDNA (pink). The legend in d applies to (b–g). In b, the dashed line (better visible in the zoom, top left) indicates the unstretched contact angle  . In the inset at the bottom, we show the relative deviation between the predicted θ and the unstretched
  contact angles:
  .
.

