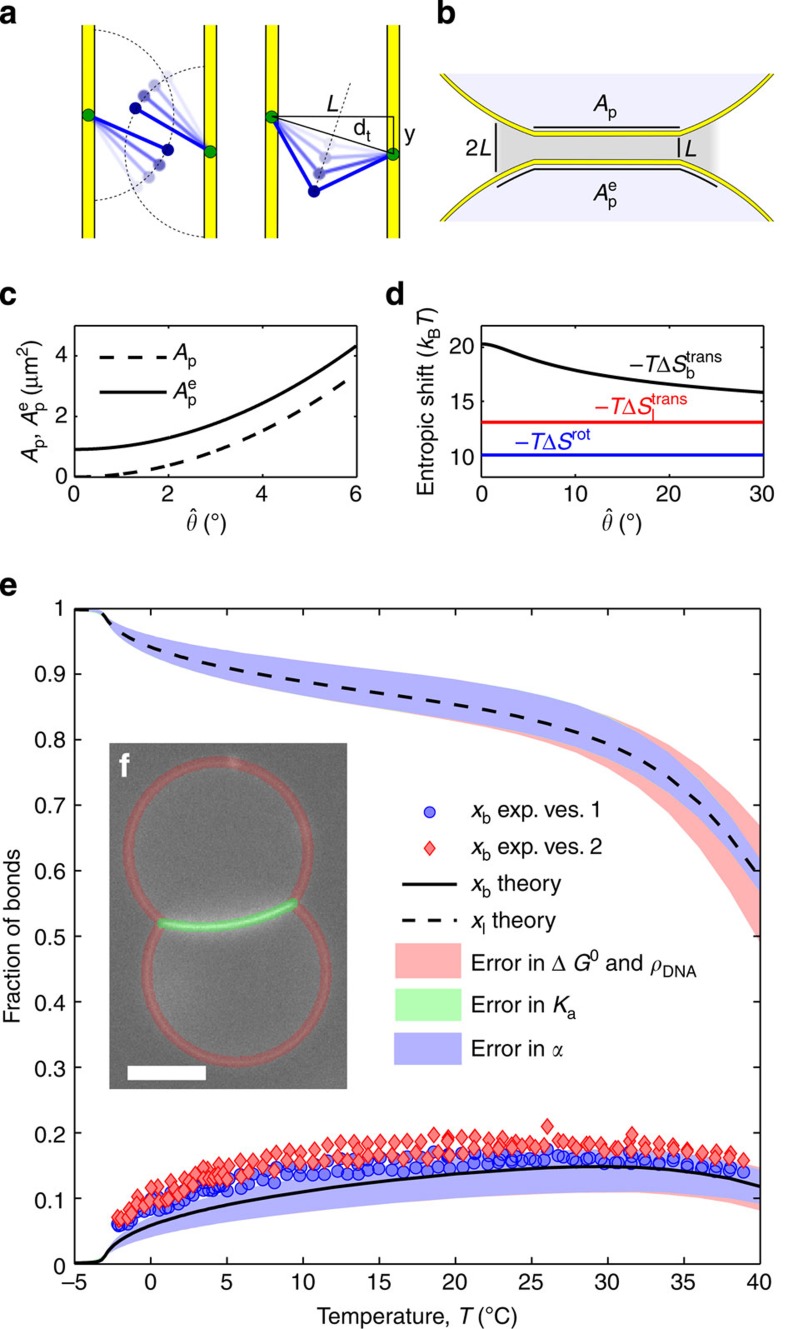
Figure 3. DNA hybridization.
(a) Sketch demonstrating the loss of orientational entropy following the formation of a bridge. (b) Sketch of the effective patch area for bridge formation  . (c) Comparison between the contact-angle dependence of
  and Ap: the latter decays to zero for
  . (d) Translational entropy loss for bridge (black) and loop (red) formation (equation 9) and rotational entropy loss (blue, equation 8). (e) Fraction of bound tethers: Experimental estimates of xb (symbols) and theoretical prediction for the fraction of bridges (xb, solid line) and loops (xl, dashed line). Shaded regions indicate the error bars of the model propagated independently from uncertainties in α (light blue), Ka (light green) and combining those from ΔH0, ΔS0 and ρDNA (pink). The model parameters are given in Table 1. Exp. ves. 1/2, experimental data for vesicle 1/2. (f) Snapshot of a pair of adhering DNA-GUVs. The shaded regions are used to estimate the average fluorescent intensity of the adhering (green) and non-adhering (red) portions of the GUVs. Scale bar, 10 μm.

