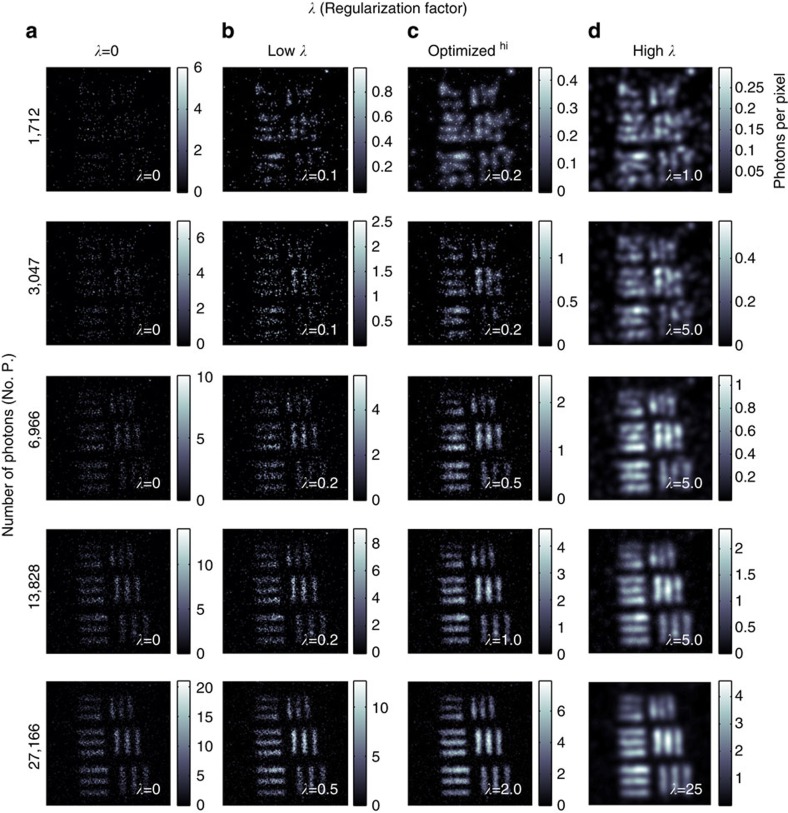
Figure 3. Regularized images of a USAF test target.
Original data containing an increasing number of photons in the accumulated image in the left-hand column and reconstructed images for increasing values of λ in columns b–d. b shows the reconstructed images weighted towards maximizing the log likelihood, d shows the reconstructed images obtained when the optimization algorithm is overly weighted towards increasing the sparsity in the spatial frequency space and c shows the reconstructed images with λ adjusted to give subjectively the best images. Scale bar, 400 μm.

