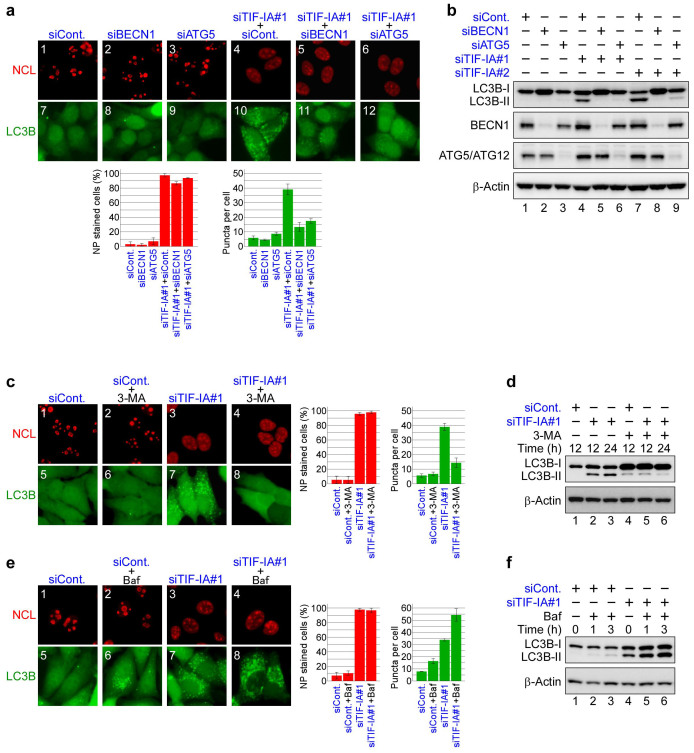
Figure 3. TIF-IA knockdown-dependent autophagy is repressed by autophagy factor knockdown or by autophagy inhibitors.
(a) Knocking down BECN1 and autophagy protein 5 (ATG5) repressed formation of the EGFP-LC3B punctate structures dependent on TIF-IA knockdown. MCF-7/EGFP-LC3B cells were treated with combinations of the indicated siRNAs for 60 h. Immunofluorescent staining and the statistical analysis were performed in the same manner as shown in Figure 1. (b) Knocking down BECN1 and ATG5 repressed conversion of LC3B-I to LC3B-II. MCF-7/EGFP-LC3B cells were treated with the indicated siRNAs for 60 h. Cell lysates were prepared and analysed by immunoblot. (c) 3-Methyladenine (3-MA) repressed formation of the EGFP-LC3B punctate structures dependent on TIF-IA knockdown. MCF-7/EGFP-LC3B cells were treated with siCont or siTIF-IA#1 for 36 h before treatment without or with 3 mM 3-MA for 12 h. Immunofluorescent staining and the statistical analysis were performed in the same manner as shown in Figure 1. (d) 3-MA repressed the LC3B-I to LC3B-II conversion dependent on TIF-IA knockdown. MCF-7/EGFP-LC3B cells were treated with the indicated siRNAs for 36 h before treatment without or with 3 mM 3-MA for the indicated times. Cell lysates were prepared and analysed by immunoblot. (e) Bafilomycin A1 enhanced formation of the EGFP-LC3B punctate structures dependent on TIF-IA knockdown. MCF-7/EGFP-LC3B cells were treated with siCont or siTIF-IA#1 for 48 h before treatment without or with 100 nM bafilomycin A1 for 2 h. Immunofluorescent staining and the statistical analysis were performed in the same manner as shown in Figure 1. (f) Bafilomycin A1 enhanced accumulation of the LC3B-II protein dependent on TIF-IA knockdown. MCF-7/EGFP-LC3B cells were treated with the indicated siRNAs for 48 h before treatment without or with 100 nM bafilomycin A1 for the indicated times. Cell lysates were prepared and analysed by immunoblot. Results are expressed mean ± standard deviation of triplicate experiments. Complete scans of the blots are presented in Supplementary Figures S15–S17.

