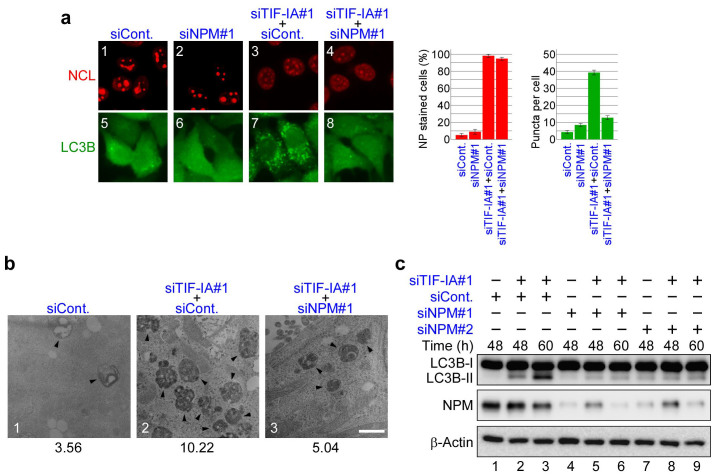
Figure 5. NPM knockdown represses RNA Pol I transcription factor knockdown-dependent autophagy.
(a) NPM knockdown repressed formation of the EGFP-LC3B punctate structures dependent on TIF-IA knockdown. MCF-7/EGFP-LC3B cells were treated with siCont (panels 1 and 5), siNPM#1 (panels 2 and 6), siTIF-IA#1 and siCont (panels 3 and 7) or siTIF-IA#1 and siNPM#1 (panels 4 and 8) for 60 h. Immunofluorescent staining and the statistical analysis were performed in the same manner as shown in Figure 1. Results are expressed as mean ± standard deviation of triplicate experiments. (b) Electron micrographs indicate that NPM knockdown repressed autophagy dependent on TIF-IA knockdown. MCF-7 cells were treated with siCont (panel 1), siTIF-IA#1 and siCont (panel 2) or siTIF-IA#1 and siNPM#1 (panel 3) for 60 h, followed by observations under a transmission electron microscope. Autophagic vacuoles (autophagosomes and autolysosomes) are indicated by the arrowheads. Bar, 1 μm. Lower number denotes the percentage of the area of autophagic vacuoles to the cytoplasmic area. (c) NPM knockdown repressed conversion of LC3B-I to LC3B-II dependent on TIF-IA knockdown. MCF-7/EGFP-LC3B cells were treated with siCont (lane 1), siTIF-IA#1 and siCont (lanes 2 and 3), siNPM#1 (lane 4), siTIF-IA#1 and siNPM#1 (lanes 5 and 6), siNPM#2 (lane 7) or siTIF-IA#1 and siNPM#2 (lanes 8 and 9) for the indicated times. Cell lysates were analysed by immunoblot. Complete scans of the blots are presented in Supplementary Figure S20.

