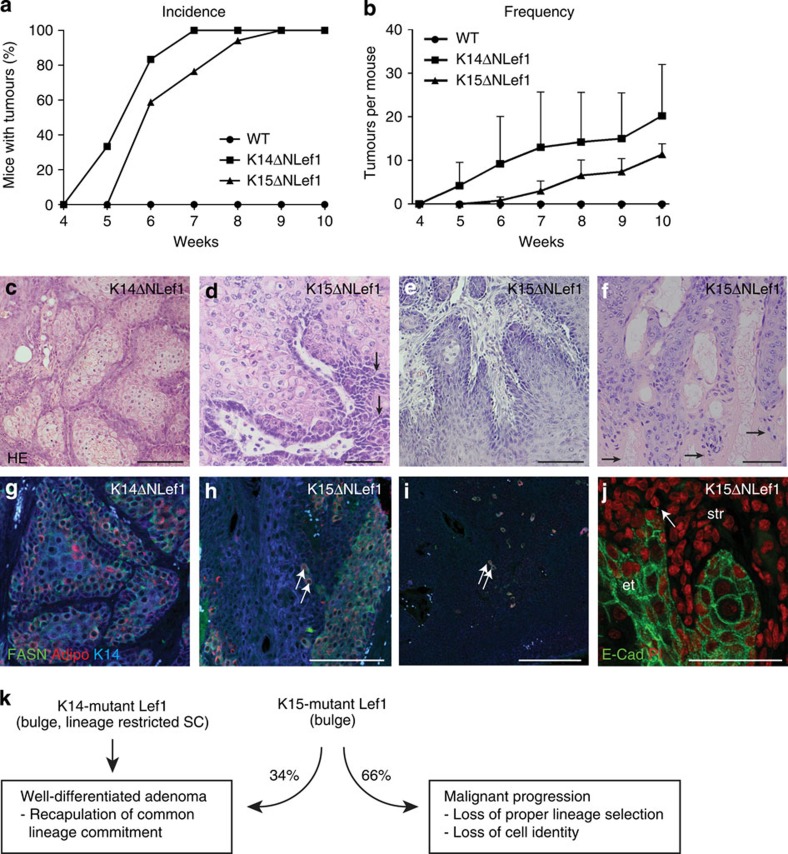
Figure 3. SC-driven mutant Lef1 leads to sebaceous tumour formation.
(a,b) Incidence and frequency of tumours developing in K14ΔNLef1 (n=6), K15ΔNLef1 (n=17) and control (n=10) mice at indicated time points following DMBA application. Results are presented as mean±s.d.; P-values are K14ΔNLef1 versus wt 0.0209; K15ΔNLef1 versus wt 0.0062 and K14ΔNLef1 versus K15ΔNLef1 0.1738 (b). (c–f) Histology of representative tumours generated in K14ΔNLef1 (n=9) (c) and K15ΔNLef1 mice (n=58) (d–f). (g–i) Detection of K14 (blue) and sebocyte differentiation marker FASN (green) and Adipophilin (red) in tumour lobules of K14ΔNLef1 (n=3) (g) and K15ΔNLef1 (n=4 mice, 12 tumours) mice (h,i, arrows). (j) Immunofluorescent detection of E-Cadherin (green) reveals loss of cell adhesion in K15ΔNLef1 tumours and malignant invasion of tumour cells into surrounding stroma. PI (red) was utilized as nuclear counterstain. str, stroma; et, epithelial tumour (n=4 mice, 12 tumours). (k) Summary of tumour phenotypes seen in K14ΔNLef1 and K15ΔNLef1 mice. Scale bars, 50 μm.

