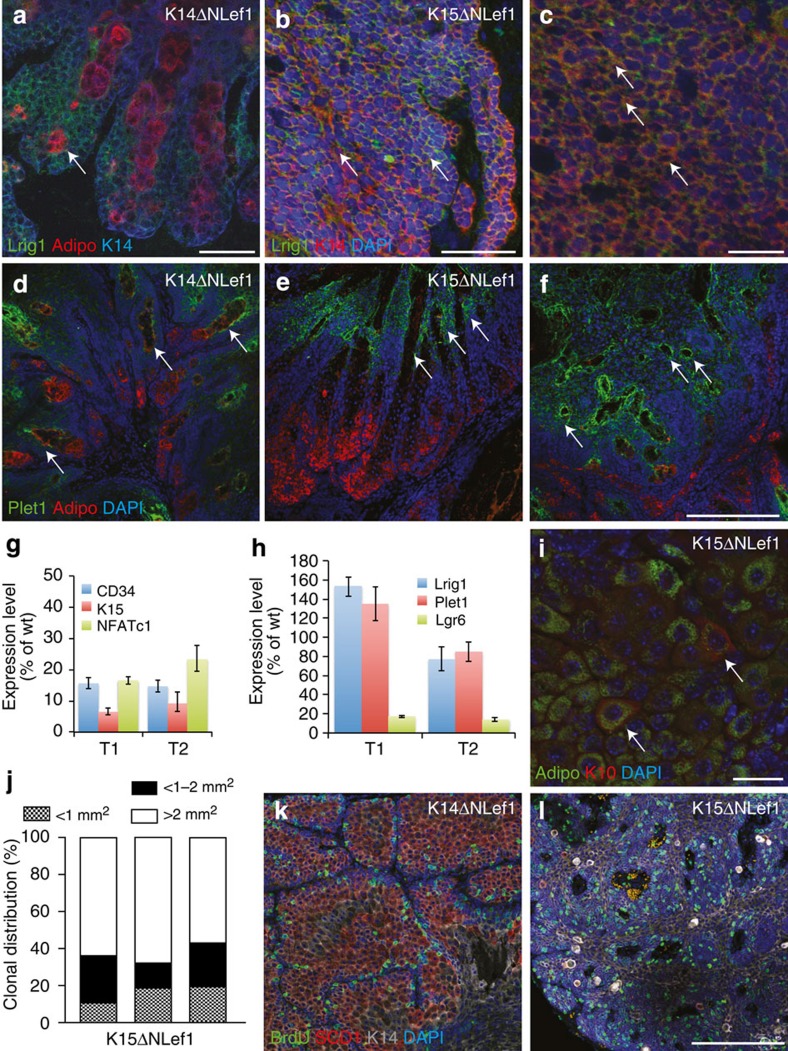
Figure 4. Cellular plasticity in SC-driven sebaceous tumours.
(a–c) Immunofluorescent detection of Lrig1 (green), adipophilin (red), K14 (blue; a, arrows) and K14 (red) and nuclei (blue, 4',6-diamidino-2-phenylindole (DAPI)) (b,c) in tumours of K14ΔNLef1 (n=3) (a) and K15ΔNLef1 (b,c) mice (n=4 mice, 12 tumours). Note that K15ΔNLef1 tumours display Lrig1 expression in most of the cells (arrows in b,c). (d–f) Plet1 protein (green) localization in tumours isolated from K14ΔNLef1 (d) and K15ΔNLef1 (e,f) mice. Plet1 is confined to basal and ductal cells in differentiated tumours (d,e, arrows), whereas scattered throughout the tumour tissue (f) in the carcinoma. Adipophilin (red) depicts the mature sebocytes in tumour sections and nuclei (blue) are counterstained. (g,h) Expression of bulge SC marker CD34, K15 and NFATc1 (g) and JZ/I-marker Plet1, Lrig1 and Lgr6 (h) in tumours isolated from K15ΔNLef1 mice (T1 and T2) analysed by qRT–PCR. Samples were normalized to 18S and wild-type (wt) controls and s.d. was calculated (n=6 tumours, n=3 mice). (i) Defects in cell fate decision of tumour cells from K15ΔNLef1 mice as evidenced by Adipophilin (green)/K10 (red) staining in same cells (arrows; n=4 mice, 12 tumours). (j) Colony-forming assay with primary tumour cells isolated from K15ΔNLef1 mice (n=3). (k,l) BrdU (green) incorporation in tumours of K14ΔNLef1 (n=3) (k) and K15ΔNLef1 mice (n=4 mice, 12 tumours; l). Tumours are stained for SCD1 (red), K14 (grey) and nuclei (blue, DAPI) (n=6). Scale bars, 50 μm.

