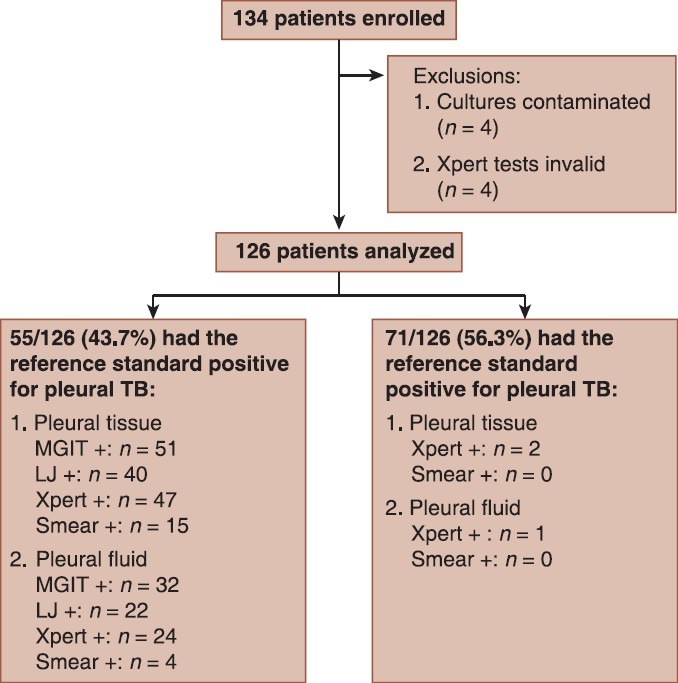
Figure 1.

Patient enrollment flow diagram showing the number of patients enrolled and analysed: TB = Tuberculosis; LJ = Lowenstein-Jensen

Patient enrollment flow diagram showing the number of patients enrolled and analysed: TB = Tuberculosis; LJ = Lowenstein-Jensen