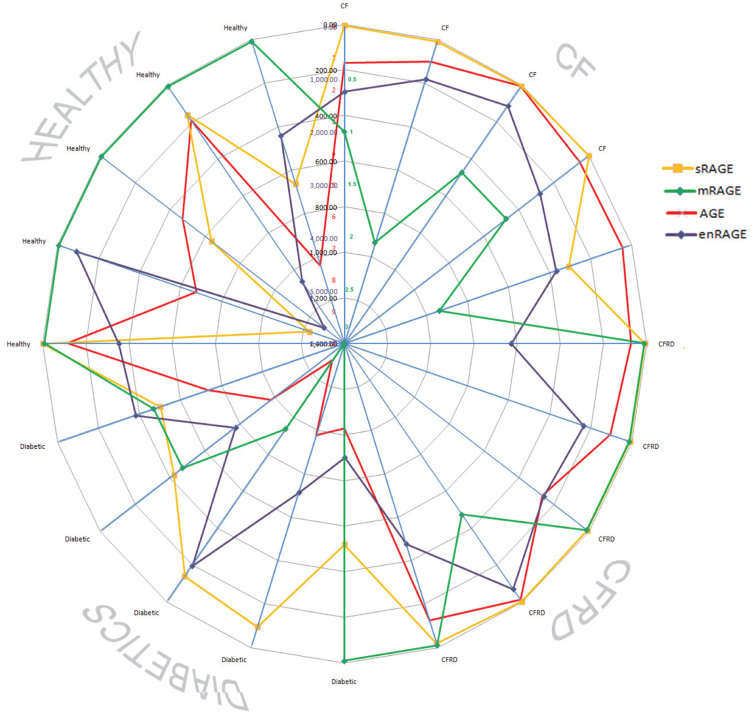
Figure 6. Expression of membrane flRAGE (mRAGE), sRAGE, AGE and enRAGE in induced sputum of patients in all disease groups.
Radar graph displays levels of membrane-bound (m)RAGE, soluble (s)RAGE, advance glycation end products (AGE) and enRAGE expression for each patient in Healthy, CF, CFRD and Diabetes group. Each mediator is presented on the appropriate scale; mRAGE (0-3, green line and numbers) enRAGE (0-6000, blue line and numbers); AGE (0-10, red line and numbers) and sRAGE (0-1400, yellow line, black numbers), with highest numbers being in the centre of the graph.

