
Figure 7. Correlation between FEV1%pred and mediators in sputum.
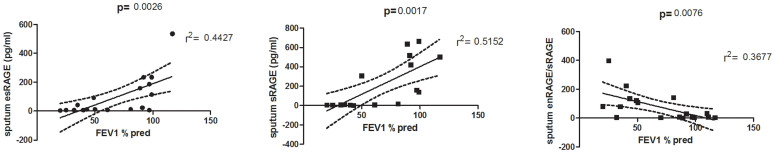
Graph represents the correlation between FEV1%predicted and a) endogenous soluble (es)RAGE b) soluble (s)RAGE and c) ratio of enRAGE/sRAGE in sputum of patients.
Official websites use .gov
A
.gov website belongs to an official
government organization in the United States.
Secure .gov websites use HTTPS
A lock (
) or https:// means you've safely
connected to the .gov website. Share sensitive
information only on official, secure websites.
Graph represents the correlation between FEV1%predicted and a) endogenous soluble (es)RAGE b) soluble (s)RAGE and c) ratio of enRAGE/sRAGE in sputum of patients.