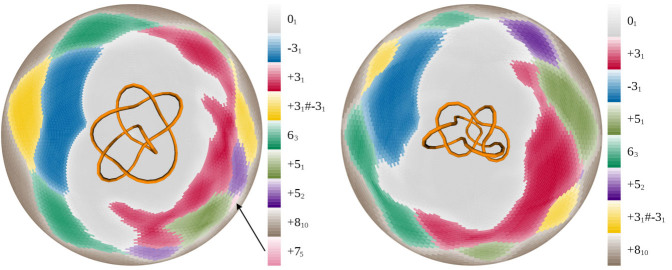
Figure 3. Comparison of disk matrices for KnotPlot (A) and ideal knot (B) configurations of the 810 knot.

Notice that the 75 knot is visible as one of the subknots in the disk matrix of the KnotPlot configuration (indicated with an arrow), whereas the ideal knot configuration does not contain this subknot. The KnotPlot and ideal knot configurations of the 810 knot are shown over the center of their disk matrices.
