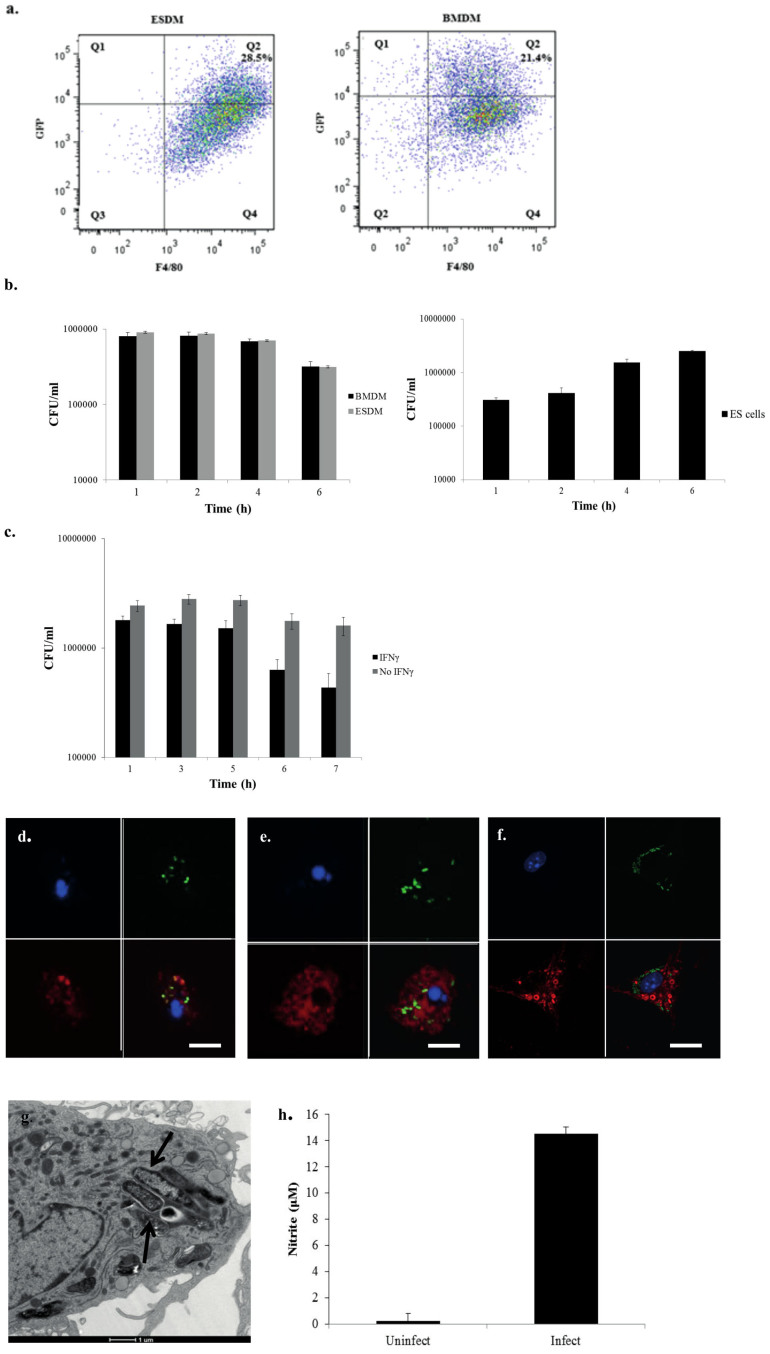
Figure 2. Phenotypic analyses of S. Typhimurium SL1344 (pSsaG)-infected ESDM and BMDM.
(a) Representative flow cytometry of infected ESDM (left) and BMDM (right), after 4 h post-infection assessing the numbers of cell containing internalized GFP expressing S. Typhimurium SL1344 (pSsaG), (b) Bacterial viable cell counts enumerated from untreated ESDM, BMDM (combined left), ES cells (right), (c) IFNγ-pre-treated and un-treated ESDM, infected for various time points by the gentamicin assay (please note that the number of bacterial cells internalized in Fig. 2c was higher by about 3 fold compared to Fig. 2b, due to intrinsic variability and the different cell batches used). Confocal images of ESDM infected with S. Typhimurium stained with DAPI (blue) for the ESDM nucleus and either (d) anti-CSA-1 (red), (e) anti-Lamp-1 (red), and (f) caspase staining reagent SR-VAD-FMK. Upper left panels nuclei-stained only, upper right panels GFP- expressing S. Typhimurium inside SCV only, lower left CSA-1 (d), Lamp-1 (e) or caspase (f)-stained only, lower right merged images. Scale bars 10 μm. (g) Transmission electron microscopy image of S. Typhimurium localized within SCV of an ESDM. Arrows point to SCV. (h) Nitrite production measured in the culture supernatants of uninfected and infected samples of ESDM at 6 h post-infection.

